Download
1 / 20
200 likes | 227 Vues
Gain valuable insights into analytical tools driving climate policy discussions. Explore categories of sustainable development models, ESMAP's tools, and the demand for low carbon development analysis. Discover key questions challenging PMR participants and why models are crucial for informed decision-making. Delve into the limitations and strengths of various analytical models and their applications in different sectors and countries. Learn about modeling categories like engineering-related, optimization, simulation, accounting, and hybrid models. Uncover the benefits of tools like META, EFFECT, MACTool, and TRACE in guiding climate policy decisions for a sustainable future.

E N D
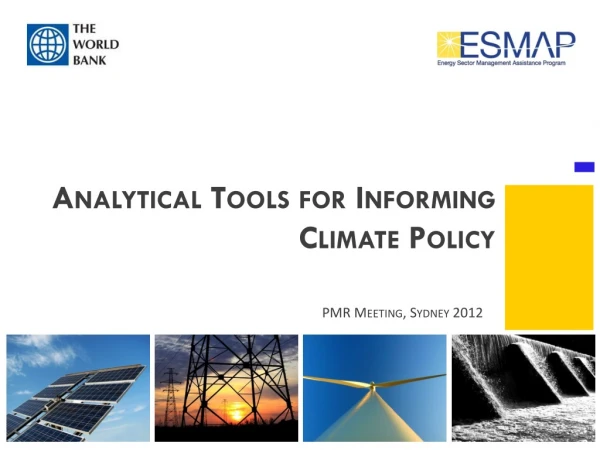
Analytical Tools for Informing Climate Policy PMR Meeting, Sydney 2012
Agenda • ‘Analytical tools’ demand drivers • Broad categories of analytical models in sustainable development • ESMAP’s models • Way forward
Fundamental drivers of the demand for Low Carbon Development analytical tools • Reducing emissions • Accessing energy • Accessing finance • Reducing energy costs • Improving energy security • Developing industrial advantage
Analytical questions challenging many PMR participants • How do we meet GHG emission targets without compromising development? • What are the economic implications of meeting the targets to : • the different sectors in our economy • trade with our partners • geographic distribution of economic activity • What is the reference case of our economy, and where will be in 20 years? • What is the cost and attractiveness of abatement technologies or activities? • What data do we have, and what data do we need? • What kind of assumptions do we need to make?
Why are models one of the tools for answering questions facing many governments Countries need models : • Models improve the understanding of climate policy analysis, which is often complex involving many variables interacting over time • Models lower the hurdle into understanding climate policy/ low carbon development since the emphasis is fairly new in many developing countries • Models require fairly limited resources to get started Models do not answer all questions: • Models are an informed simplification of reality • Garbage in, and garbage out • Limitations based on assumptions, computational challenges and knowledge gaps
Agenda • ‘Analytical tools’ demand drivers • Broad categories of analytical models in sustainable development • ESMAP’s models • Way forward
Three broad categories of models Engineering-related Models Optimization Simulation Accounting Aggregated Macroeconomic Model Hybrid Models Energy Forecasting Framework and Emissions Consensus Tool (EFFECT) Long range Energy Alternatives Planning System (LEAP) Applied Dynamics Analysis Global Economy (ADAGE) Global Trade and Environment model (GTEM) Integrated Planning Model (IPM)
Aggregated Macroeconomic Model Application: US “cap and trade bill” - Lieberman-Warner Act • Applied Dynamics Analysis Global Economy (ADAGE) • Global model which covers all interaction among business and households. Does economic modeling in addition to energy, environmental, climate change mitigation analysis • Strengths:Better suited for modeling the long run, international analyses • Weaknesses: Weak on technological representations
Hybrid model application: US “cap and trade bill” - Lieberman-Warner Act • MiniCam • Highly integrated model which focuses on energy, agricultural systems and greenhouses gases • Strengths:Strong focus on technological gap between business as usual and atmospheric stabilization • Weaknesses: • Integrated Planning Model (IPM) • More focused on environmental policy and the power sector in the 48 US States; with a stronger focus on the environmental impact of power policy • Strengths:Better suited for short run • Weaknesses: Relatively weak on technology options
Engineering-related model application – Marginal Abatement Cost Curves for Turkey • Marginal Abatement Cost Curve models (e.g. MACTool, McKinsey, etc) • Shows the cost of reducing a ton co2 emissions using different options • Strengths:easy to visualize complex information, several models available • Weaknesses: can be data intensive
Progress • ‘Analytical tools’ demand drivers • Broad categories of analytical models in development • ESMAP’s models • Way forward
ESMAP’s LCD Planning Tools META| EFFECT | MACTool | TRACE ESMAP developed tools that currently do the following: META | Help countries choose electricity supply options EFFECT| Build development scenarios and forecast their impact on GHG emissions MACTool | Identify the marginal abatement costs associated with each scenario TRACE | Assess energy efficiency opportunities at the city-level
Why EFFECT? Strong Demand from Countries: • Building LCD scenarios consistent across sectors • Forecasting GHG emissions Key Advantages of EFFECT: • Transparent - Enables consensus building among a wide range of stakeholders • Flexible - Enables customization to suit local conditions • Adept - Compiles a large amount of local data from multiple sources EFFECT Use: • Brazil, China, Georgia, India, Indonesia, Macedonia, Nigeria, Philippines, Poland, Thailand, Vietnam,
Georgia Example: LCD Scenario Comparison With all else being equal, public transportation interventions result in a greater reduction in fuel consumption Baseline Scenario 2: Public Transportation Scenario 1: Private Transportation
Why MACTool? Countries conducting low carbon studies/implementing Cap-and-Trade systems to achieve voluntary emission reductions. There is need to: • Achieve the targets efficiently • Choose among many mitigation options • Know the potential results • Know the potential costs Key Advantages of MACTool: • Considers the break-even carbon price • Discount rate customizable by technology • Visual display of the results easy to share with stakeholders MACTool Use • Macedonia, Vietnam, Brazil
Marginal Abatement Cost Curve Marginal Abatement Cost ($/tCO2e) Net Cost Costs > Benefits Reforestation $42/tCO2 Cumulative Mitigation Potential of LowCarbon Options (MtCO2e) Net Benefit Costs < Benefits Abatement Potential = 916 MtCO2during the period considered (2010-2030)
The Break-even Carbon Price Example Mitigation Option: Cogeneration from Sugarcane Key Questions YES: Extracting condensing turbine, 90 bars Is there an option for a low-carbon scenario? Public Sector 158 MtCO2e (7.5MtCO2/year) What is the mitigation potential ? YES: Marginal Abat. Cost = - $ 105 /tCO2 (8% social discount rate) Does it make sense economically from a public planning perspective ? Would it happen spontaneously ? NO: Private Sector Expected IRR is 18% > 8% Incentive required = + $ 8 /tCO2 Break-Even Carbon Price = +$8/tCO2 Private Sector Additional investment = + $ 35 billion (+$1.6 bi /year) How much financing is needed ?
Testing liquidity and equilibrium priceMACTool allows to set (and modify) caps and build (and update) the expected Carbon DemandandSupplyCurves Caps set in MACTool at 30% of total abatement potentials of selected sectors Possible Equilibrium Price When Price decreases, Demand increases When Price decreases, Supply decreases
Agenda • Drivers of the demand for analytical models • Broad categories of analytical models in development • ESMAP’s models • Way forward
An Open Platformfor Low Carbon Development/Climate-Smart Planning Instruments • Platform will enable: • Open-access • Crowd-sourcing • Collaboration • Data sharing • Client Benefits: • One-stop platform • Community of users • Technical support LEDs globalpartnership A partnership among On-going discussions with