Probe
Explore the latest molecular imaging modalities and contrast agents in CT scans, understanding their diagnostic utility, sensitivity, and specificity. Discover opportunities in microCT for enhanced anatomical and physiological insights.

Probe
E N D
Presentation Transcript
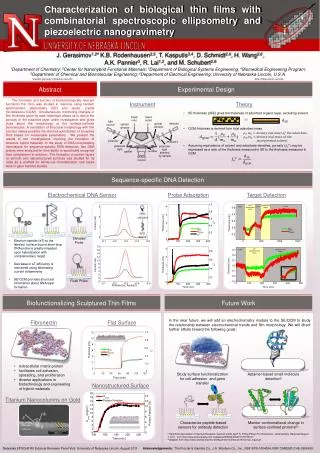
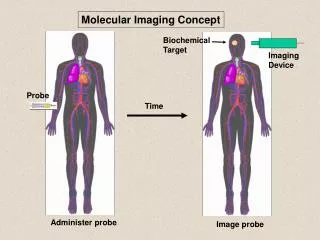
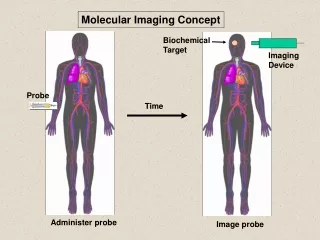
Molecular Imaging Concept Biochemical Target Imaging Device Probe Time Administer probe Image probe
Diagnostic Utility Sensitivity - Ability to either detect the probe signal at the target (direct response) or change in a signal that is dependent on the quantity of probe at the target (indirect response) Specificity - Ability to distinguish the target from nontarget processes or tissues
Molecular Imaging Modalities • Gamma ray emission • Positron emission – annihilation photons (PET) • Single photon emission (SPECT) • Direct signal from tissue in response to probe concentration • Gamma ray absorption • Used in CT scans • Contrast with high atomic number nuclei that absorb gamma rays (Iodine) • Magnetic resonance • Protons provide signal in clinical MRI scans • Perturb proton relaxation with Gd contrast agents • Use paramagnetic nuclei (e.g., 13C, 19F) labeled probes • Optical • Fluorescent molecules (luciferase/luciferin; GFP) • Visible wavelengths have limited depth of detectability • Infrared extends depth a bit • Ultrasound • Acoustic absorption/modification (microbubbles) • Thermoacoustic stimulation (absorption probes)
CT Contrast Agents • High atomic number – x-ray absorption • Ba, I, Gd, Au • Intraintestinal or intravascular (extracellular) Examples: Barium sulfate (oral, rectal admin.) iopromide (iodinated IV contrast agent)
Radioapague Contrast Agent Enhance the Organ Delineation Stomach liver Kidneys Ovarian With contrast administration Without contrast administration
Catheter The representative CT images of a dynamic sequence with iodinated contrast enhancement. From top to the bottom, one can see the flowing path of the contrast medium within the blood stream: from tail vein to vena cava, to heart, and then to kidney. These three images are associated with the first 8 seconds of the sequence. The complete sequence is typically recorded over a period of 10 minutes to track both arterial/capillary and venous wash out phases. The representative CT images of a dynamic sequence with iodinated contrast enhancement. From top to the bottom, one can see the flowing path of the contrast medium within the blood stream: from tail vein to vena cava, to heart, and then to kidney. These three images are associated with the first 8 seconds of the sequence. The complete sequence is typically recorded over a period of 10 minutes to track both arterial/capillary and venous wash out phases. The representative CT images of a dynamic sequence with iodinated contrast enhancement. From top to the bottom, one can see the flowing path of the contrast medium within the blood stream: from tail vein to vena cava, to heart, and then to kidney. These three images are associated with the first 8 seconds of the sequence. The complete sequence is typically recorded over a period of 10 minutes to track both arterial/capillary and venous wash out phases. The representative CT images of a dynamic sequence with iodinated contrast enhancement. From top to the bottom, one can see the flowing path of the contrast medium within the blood stream: from tail vein to vena cava, to heart, and then to kidney. These three images are associated with the first 8 seconds of the sequence. The complete sequence is typically recorded over a period of 10 minutes to track both arterial/capillary and venous wash out phases. vena cava Catheter Catheter Catheter Catheter Catheter Catheter Catheter Catheter Catheter Catheter Catheter kidney spine vena cava heart Contrast Time-Density Curves: Contrast Time-Density Curves: Contrast Time-Density Curves: Contrast Time-Density Curves: Catheter Catheter Catheter Catheter Catheter Catheter Catheter Catheter Catheter Catheter Catheter vena cava vena cava vena cava vena cava vena cava vena cava vena cava vena cava vena cava vena cava vena cava kidney kidney kidney kidney kidney kidney kidney kidney kidney kidney kidney spine spine spine spine spine spine spine spine spine spine spine vena cava vena cava vena cava vena cava vena cava vena cava vena cava vena cava vena cava vena cava vena cava heart heart heart heart heart heart heart heart heart heart heart vena cava vena cava vena cava vena cava vena cava vena cava vena cava vena cava vena cava vena cava vena cava Opportunities in microCT:Anatomy and physiology The representative CT images of a dynamic sequence with iodinated contrast enhancement. From top to the bottom, one can see the flowing path of the contrast medium within the blood stream: from tail vein to vena cava, to heart, and then to kidney. These three images are associated with the first 8 seconds of the sequence. The complete sequence is typically recorded over a period of 10 minutes to track both arterial/capillary and venous wash out phases. The representative CT images of a dynamic sequence with iodinated contrast enhancement. From top to the bottom, one can see the flowing path of the contrast medium within the blood stream: from tail vein to vena cava, to heart, and then to kidney. These three images are associated with the first 8 seconds of the sequence. The complete sequence is typically recorded over a period of 10 minutes to track both arterial/capillary and venous wash out phases. The representative CT images of a dynamic sequence with iodinated contrast enhancement. From top to the bottom, one can see the flowing path of the contrast medium within the blood stream: from tail vein to vena cava, to heart, and then to kidney. These three images are associated with the first 8 seconds of the sequence. Contrast Time-Density Curves: Contrast Time-Density Curves:
Proton MR Contrast Agents • Positive contrast agents (appearing bright on MRI) Small molecular weight compounds containing as their active element Gadolinium (Gd), Manganese or Iron Unpaired electron spins in their outer shells and long relaxivities, which make them good T1 relaxation agents. Examples: GD-DTPA, Gadopentetate dimeglumine, gadoteridol, and gadoterate meglumine are utilized for the central nervous system and whole body Mangafodipir trisodium for lesions of the liver Gadodiamide for the central nervous system.
Proton MR Contrast Agents • Negative contrast agents (appearing predominantly dark on MRI) are small particulate aggregates often termed superparamagnetic iron oxide (SPIO). These agents produce predominantly spin-spin relaxation effects, but very small particles smaller than 300 nm also produce substantial T1 relaxation. • A special group of negative contrast agents (appearing dark on MRI) are perfluorocarbons because their presence excludes the hydrogen atoms responsible for the signal in MR imaging.
MR Molecular Probes • Some MR contrast agents require biocompatible carriers/capsules • Reduce toxicity – hide the bad guy inside • Target specific cells/proteins/processes Examples: Ferumoxide – SPIO core particles (~150nm), dextran T-10 covering Nanomag – SPIO particles (50nm) with cross-linked dextran and amino acid sequences to form bonds to organic compounds P7228 – SPIO, anionic dextran layer – can be encapsulated by positively charged liposomes
Biologically Important NMR Nuclei 1H - Wall thickness, ejection fraction, wall motion, perfusion, coronary artery angiography. (large signal from ~50M concentration in tissues) 31P – ATP, PCr, Pi, PDE, PME, pHi, [Mg2+], kinetics of creatine kinase and ATP hydrolysis. 23Na – Transmembrane Na+ gradient, tissue and cartilage structure. 13C – Glycogen, metabolic rates, substrate preference, drug metabolism, etc. 19F – Drug metabolism, pH, Ca2+ and other metal ion concentration, pO2, temperature, etc. 2H – Perfusion, drug metabolism, tissue and cartilage structure. In vivo detection sensitivity limits use of C-13 and F-19 molecular probes (C-13 requires >0.1mM, F-19 >5 mM)
Advantages of PET • PET has high sensitivity (~pmol of probe can be detected) • PET images biochemistry. Small radionuclides (C-11, • F-18) label small biological molecules with retention of biological specificity. • PET images are quantitative
General Aspects of PET Tracers • Understanding of targeted biochemical process • Practical synthesis: sufficient yield and purity, automated • Tissue uptake and kinetics are specific to targeted process • Fate of radiolabel understood for metabolized tracers • Tracer distribution is sensitive to answer clinical questions relevant to diagnosis, prognosis or monitoring of therapy • Tissue kinetics amenable to mathematical modeling to give quantitative indices
Positron Decay nuclide half-life C-11 20.3 min N-13 10 min O-15 124 sec F-18 110 min I-124 4.2 d (+ high Energy photon) e.g., 18F 18O + e+ +
Biochemical/Physicological Targets for PET Imaging • Substrate metabolism • carbohydrates, fatty acids, amino acids, oxygen, nucleosides, oligonucleotides • Receptor binding • adrenergics, cholinergics, neurotransmitters, hormone receptors, growth factor receptors • Ionic transport • Na, K, Ca, F, Cl, I • Perfusion • water, ammonia, butanol • pH • Blood volume (11CO, C15O) • Hypoxia (misonidazoles) • Redox potentials • Protein-protein interactions • monoclonal antibodies • Gene expression • reporter genes and probes
Challenge #1: Radiochemical limitations • Short radionuclide half-life (<2 hr) • Limited radionuclide availability • Radiation exposure to chemist >90% of PET probes are synthesize by simple 1 or 2 step labeling followed by purification and formulation Synthesis times typically under 45 min for C-11 (t 1/2 = 20 min) and under 2 hr for F-18 (t 1/2 = 110 min)
Challenge #2: Biochemical Complexity TARGET
Challenge #3: The radioimaging signal is chemically nonspecific *Probe *(Intermediates) *TARGET *Nonspecific binding to proteins or membranes *alternative binding or metabolic products *systemic metabolites (i.e. hepatic) Specificity! Specificity! Specificity!
Challenge #4: Physiological Barriers To Delivery of Probe to the Target Arterial Blood TARGET (Subcellular compartmentation may also limit delivery) Transport of probe to target should not be rate-limiting Limits utility of technique in poorly perfused tissues
Challenge #4B: Subcellular Barriers of Delivery TARGET Again, transport of probe to target should not be rate-limiting, And probe must be able to leave cell if not acted upon.
11C-Acetylene as PET Probe and Labeling Intermediate • 11C-acetylene (C2H2) may be useful as a radio-labeling intermediate for organic molecules in physiology studies • [11C]C2H2, by itself, can be used in perfusion studies (i.e. brain)
Comparison of PET Tracers for Measuring Tissue Perfusion * Using proton accelerator and most common nuclear reaction for production
Trap on Ba • 900 C / H2 Ba*CC *CCH2 (Madsen et al., 1981) * Bu-Li H*CCLi + * * NaOH + * [3,4-11C]-2-oxo-butynoic acid (COBA)
Computer-controlled Apparatus for synthesis of C-11 Acetylene
Gas Chromatography/ Mass Spec of C-11 Acetylene Product Standard Product
Gas Chromatography / Rad. Detection of C-11 Acetylene Product
Target: Myocardial Fatty Acid Oxidation •Long-chain fatty acids are the predominant substrates for production of ATP in heart. • Abnormalities of fatty acid oxidation by the myocardium are associated with ischemic heart disease, congestive heart failure, cardiomyopathies, and deficiencies of carriers, enzymes or co-factors required for fatty acid transport or oxidation. • The lack of a specific radiolabeled probe of fatty acid oxidation has impeded the development of a non-invasive technique for assessment of fatty acid oxidation.
Myocyte Lipids lipase LCFA-CoA LCFA VLAD CPT-II CPT-I hyd. FATr MTP LCFA-carn LCFA-CoA b-ox. LCFA ACS LCFA-carn CAT MCFA-CoA b-ox. Acetyl-CoA Mitochondrion Myocardial Metabolism of Fatty Acids
6-Thia Analogs 4-Thia Analog 14-[18F]fluoro-6-thia-heptadecanoic acid (14F6THA) 16-[18F]fluoro-4-thia-hexadecanoic acid (FTP) 17-[18F]fluoro-6-thia-heptadecanoic acid (17F6THA)
Plasma Myocyte (LC-AcylCoA synthetase) (LC-AcylCoA hydrolase) Complex Lipids (acyl transferase) Outer Membrane (CPT-I) Mitochondrion (Translocase, CPT-II) Inner Membrane (VLC-acylCoA dehydrogenase) (Mit. Trifunctional Protein) slow (spontaneous) Protein Binding
k1 k2 C1 Cp Reversible k3 k4 C2 Trapped dC1(t)/dt = k1 Cp(t) - (k2 + k3) C1(t) (1) dC2(t)/dt = k3 C1(t) - k4 C2 (t) (2) Ctot(t) = (1-BV) (C1+ C2) + BV Cp (3)
2-Compartment Model Fit to FTP Kinetics in Isolated Rat Heart
*p<0.01 * * *
F-18 FTP in Normal Human Subject Short-axis Images of Heart at 50-55 min p.i. Duke University Medical Center
Diabetic Cardiomyopathy Patient F-18 FTP (Fatty Acid Oxidation) SPECT Tc-99m Myoview Perfusion Scan