Understanding Measures of Central Tendency: Mean, Median, and Mode
In this chapter, you will learn how to determine the center of a data set through various methods. You'll identify unusual values and decide when they should be included in your measurements. Gain insight into the best measures of central tendency, including mean, median, and mode. You will learn to calculate the median as the middle value, identify the mode as the most frequently occurring value, and understand when to use each measure effectively. With practical examples and exercises, this chapter equips you with the skills to analyze data sets accurately.

Understanding Measures of Central Tendency: Mean, Median, and Mode
E N D
Presentation Transcript
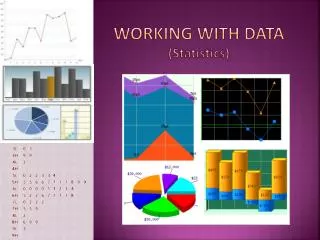
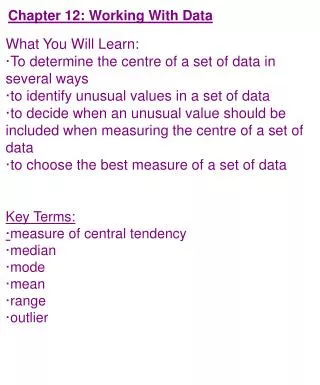
Chapter 12: Working With Data What You Will Learn: ·To determine the centre of a set of data in several ways ·to identify unusual values in a set of data ·to decide when an unusual value should be included when measuring the centre of a set of data ·to choose the best measure of a set of data Key Terms: ·measure of central tendency ·median ·mode ·mean ·range ·outlier
12.1 Median & Mode Measure of central tendency ·a value that represents the centre of a set of data ·can be the mean, median, or mode Median ·The middle number in the set of data after the data have been arranged in order ·median of 2, 5, 6, 8, and 9 is 6 ·median of 1, 3, 6, 8, 9, and 10 is ___. Mode ·the most frequently occurring number in a set of data (the number that shows up the most often) ·mode of 3, 5, 7, 7, and 9 is 7. ·modes of 2, 2, 4, 6, 6, 8, and 11 are ___ and ___. ·the data 1, 3, 4, and 5 has no mode.
Ex 1: Determine the Mode and Median One month, the Edmonton Oilers won 7 out of 10 games. As a team, they scored the following number of goals in these 10 games: 5, 4, 3, 2, 1, 5, 3, 3, 7, 3 a) What is the mode for the number of goals scored? b) What is the median number of goals scored? Arrange the numbers in increasing order. The mode is the most frequently occurring number in the list. Arrange the numbers in increasing order. The median is the middle number. Cross off pairs of least and greatest values until you reach the middle one or two numbers. If one number remains, then it is the median value. If two numbers remain, then you must find the value halfway between them. In this case, since the two numbers are both 3, the median is 3. Notice that both the mode and median are 3 in this example. The mode and median will sometimes be the same value, but not always. Try Show You Know on p. 426?
Ex 2: Determine the Mode and Median From a Frequency Table The frequency table shows the hourly wages of employees at a recycling depot. a) What is the mode for the hourly wage? b) What is the median wage? c) How would the mode and median be affected if one employee gets a raise from $10 per hour to $11 per hour? Method 1: List the Values in Order Record the hourly wages, in dollars, for each employee in increasing order. Method 2: Use the Frequency Table From the frequency table, you can determine the mode by looking at the numbers in the second column. The highest number is 3. It corresponds to 3 people who earn $8 and 3 people who earn $11. So, there are two modes: $8 and $11.
Key Ideas: The mode is the most frequently occurring number in a set of data. ·If no number repeats, there is no mode 1, 2, 3, 4, 5 -> No mode ·There can be more than one mode 1, 1, 2, 2, 3 -> 2 modes: 1 and 2 (bimodal) The median is the middle value in a set of data after the numbers have been arranged in order 1, 2, 3, 4, 5 -> Median is 3 If there is an even number of data values, then the median is the value halfway between the two numbers. 2, 4, 6, 8, 10, 12 ·The median here is the value halfway between 6 and 8, which is 7. The median does not have to be a number in the set of data.
Assignment p. 426, #1-4, 6, 8, 10, 11, MathLink Still Good? #12 Pro Star? # 13-17
12.2: Mean Intro: Early in the school year, Melanie and Amir had the exact same scores on five weekly math quizzes. Their scores out of 10 were 8, 9, 4, 5, 9. Their teacher asked them to report on a single score that best summarizes their progress in math. Amir decides to use the median: Melanie decides to use the mode: Who do you think is right? Why?
Amir and Melanie's teacher was not satisfied with the way Amir and Melanie calculated their math midterm reports. She did not feel that the median and mode provided a correct view of their performances. Their teacher asked the students to explore another way of representing the centre of the data. Build a tower that represents each score that Amir and Melanie received on their weekly math quizzes: 4, 5, 8, 9, 9. A tower 4 cubes high represents a score of 4 out of 10.
Key Term: Mean: ·a measure of central tendency ·the sum of a set of values divided by the number of values in the set ·for example: Mean = 6 + 8 + 4 3 = 6
Ex 1: Calculate the Mean The daily sales at More Movies for the first week after the BluRay release of The Threat of the Brain Snatchers are shown in the table. a) What is the daily mean number of sales from Monday to Saturday? b) How many sales will be needed on Sunday if More Movies hopes to have a daily mean of 100 sales for the first week?
Ex 2: Use the Mean to Make Predictions A scientist recorded the daily distance travelled by a spawning salmon five days in a row. a) What is the mean distance travelled by the salmon each day? b) How far would you expect the salmon to travel in the next ten days? Assume the salmon has not yet reached its spawning destination. c) A Chinook salmon may travel 8000 km from its feeding grounds in the North Pacific Ocean! How many days would you predict this journey to take based on the mean daily travel distance you calculated in part a)?
Key Ideas ·To calculate the mean, add all the numbers in the set of data and then divide by the number of numbers. ·The mean does not have to be a number in the set of data Ex: Mean = 4 + 6 + 8 + 10 + 6 + 7 + 15 7 = 56 7 = 8
Assignment: p. 431 # 1-3, 5, 7, 10, 11, Math Link Still Good? # 9, 12-14 Pro Star? # 15-16
12.3 Range and Outliers After this lesson, you will be able to: ·determine the range for the data sets ·identify outliers in data sets Key Terms Range: ·the positive difference between the largest and smallest values in a data set Outlier: ·a value that is much smaller or larger than the other data values ·a data set may have one or more outliers or no outliers
How can the largest and smallest values be used to describe a set of data? The following diagram shows the elevation changes for the Stomach Bender roller coaster. The measurements represent the heights of the roller coaster relative to the starting point of the ride. B (Gut Drop) D (Queasy Hill) 32 m 18 m End 0 m Start 0 m -3 m -6 m C A -21 m E
B (Gut Drop) D (Queasy Hill) 32 m 18 m End 0 m Start 0 m -3 m -6 m C A -21 m 1. Complete the table: 2. Fill in the elevations at each point. 3. a) What is the largest value? b) What is the smallest value? c) What is the range of heights for the roller coaster? 4. Do you think there are any outliers in the set of 7 locations on the roller coaster? If so, what are they? E
Ex 1: Calculate the Range A hospital recorded the following number of births in one week. a) What is the highest number of births? b) What is the lowest number of births? c) What is the range of the data?
Ex 2: Identify Outliers in a Data Set In the 1985-86 NHL hockey season, Wayne Gretzky set a record for the most points (goals + assists) recorded during a single regular season. The following table shows the top five point leaders for the 1985-1986 season and the 2005-2006 season. a) Determine the range for each season. Compare the two ranges. b) Which data value appears to be an outlier in one of the two seasons? c) Remove the outlier and determine the new range for that season. Compare the new range with the range from the other season.
Key Ideas ·The range provides information about the spread of the data. ·Range = highest value - lowest value ·Outliers are values that are very different from the rest of the numbers in a set of data. A data set can have no outliers, or one or more outliers. Assignment: p. 437, #1-3, 5, 6, 8, 9, 12, MathLink Still Good? #10, 11, 16 Pro Star? #13-15
12.4 The Effect of Outliers After this lesson, you will be able to: ·explain the effects of outliers on measures of central tendency ·justify whether outliers should be included when determining the measure of central tendency.
Ex 1: Identify Outliers Shannon practised shooting baskets every day last week to prepare for a basketball tournament. She recorded the number of baskets she made each day out of 25 shots. a) What is the range of baskets scored? b) What are the median and mean numbers of baskets scored? c) Identify any possible ouitliers. Should the outlier(s) be removed from the data set? Explain why or why not.
Ex 2: Identify Outliers and Determine Their Effects In a science experiment, students were asked to measure the length of their right thumb from the first knuckle to the end of their thumb. The table shows the lengths that were measured by ten different students. a) What is the range? b) What are the median and mean? c) Identify any possible outlier(s). Should the outlier(s) be removed from the data set? Explain why or why not. d) How would removing the outlier affect the median and mean? The mean is affected more by removing the outlier.
Key Ideas ·Outliers can affect all measures of central tendency. ·When a small set of data has an outlier, the mean is usually affected more by the outlier than the median. ·Some outliers are just as important as the other data values, while others are better removed from the data set. Assignment: p. 444, #1-3, 5, MathLink Still Good? #6, 7 Pro Star? #8
12.5 Choose the Best Measure of Central Tendency After this lesson, you will be able to: ·determine when to use mean, median, or mode to best describe a set of data ·solve problems using mean, median, and mode
Ex 1: Compare Measures of Central Tendency Amir and Melanie's weekly quiz scores were 4, 5, 8, 9, 9. Which measure(s) of central tendency best describe the data? Explain why. Mode: 9 Median: 8 Mean: 7 Do "Show You Know" on p. 447 The mean or median because they are very close to the middle of the data. The mode represents the higher marks, and not the middle of the marks.
Ex 2: Choose Mode as the Best Measure of Central Tendency Students have taken a vote on the new official school colours for sports uniforms. The number of votes for each colour is shown. Which measure of central tendency would you use to decide the winning colour? 7 4 1 5 0 6 10 V I B G Y O R
Ex 3: Compare Median and Mean Suki paid the following amounts for her last six pairs of jeans before tax: $44, $38, $45, $49, $125, $50 a) What are the median and the mean jean prices? b) Which measure of central tendency best describes these data? The median, because it is more central to the data. The mean is affected by the outlier and is therefore not the best choice.
Key Ideas ·The mode is the best measure of central tendency for data that represents frequency of choice (most popular choice) such as favourite colour, clothing and shoe sizes, or most popular musical group. ·If all the numbers in a set of data are relatively close together, either the median or mean can be used as a measure of central tendency. ·If a data set contains unusually large or small numbers relative to the rest of the data, the median is usually the best measure of central tendency. Assignment: p. 449, #1-4, 6, 9, MathLink Still Good? #8, 10 Pro Star? #11-16