Mangistau Region
150 likes | 363 Vues
Mangistau Region. Region is located in the south-west of the country. As of January 1, 2012 the area is 165 . 6 thousand square kilometers, the region's population is 545 . 7 thousand people . Density of population over the region per 1 km is 3 . 3 people .

Mangistau Region
E N D
Presentation Transcript
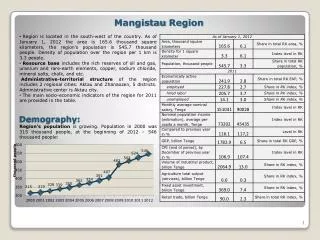
Mangistau Region • Region is located in the south-west of the country.As of January 1, 2012 the area is 165.6 thousand square kilometers, the region's populationis 545.7 thousand people. Density of population over the region per 1 km is 3.3 people. • Resource baseincludes the rich reserves ofoil and gas, uranium andrare-earth elements, copper, sodium chloride, mineral salts, chalk, and etc. • Administrative-territorial structure of the region includes 2 regional cities: Aktau and Zhanaozen, 5 districts. Administrative center is Aktau city. • The main socio-economic indicators of the region for 2011 are provided in the table. Demography: Region’s populationis growing. Population in 2000 was 315 thousand people, at the beginning of 2012– 546 thousand people: 1
Economically active population (EAP) • The number of employed population increases and unemployed population falls in both absolute and relative terms. For 10 years, from 2001 to 2011, the employed population has increased from 89 to 94%, while the number of unemployed people has fallen from11to 5%. • Characteristic feature of the employed population dynamics is the growth of hired labor and the reduction of self-employed people.From 2001 to 2011 the number of hired labor grew from76% to90%, the number of self-employed people fell from24to10%. EAP structure corresponds to the average in RK: EAPis growing with a moderate paceand in 2011 it reached 241.9 thousand people. 214.9 thousand people of them are employed, 39.6 thousand peopleare unemployed. Economically inactive population made up 94.9 thousand people, it is lower than in 2000:
The changes of employed population structure are supported by a tendency of unemployment rate reduction from 13.7% in 2000 to 5.8% in 2011 • In 2011 unemployment rate of the region was above the average in Kazakhstan – 5.4%: Unemployment Level
Quality of Life • Cost of living has been growing steadily since 2003, however and the values are above the average in RK: • Life expectancy at birth in the region is increasing and the values are above the average in Kazakhstan: • Some of life quality indicators in 2011: • Share of population with income used for consumption below the poverty line is decreasing,however, it is above the average in Kazakhstan:
Enrollment • Enrollment share of the population aged 6-24 years has decreased since 2001 and now it is below the average in RK: • The number of children in regular preschools has increased significantly since 2001: • The number of students in technical and vocational education is increasing: • The number of students in higher educationis falling,despite an increase of the region’s population:
Monthly average nominal salary per employee for 2011 is 151,041 Tenge, that is above the country’s average – 90,028 Tenge: • In the dynamics the average nominal salary per employee and the average nominal income per capita are ever-growing. • The index of the nominal and real incomes showed a decline during the economic crisisin 2009. At that time the growth of real income was lower than the consumer price index, i.e. revenue growth did not cover inflation: Population Income
GRP growth in 2011 doesn’t exceed the average growth of total GRP of all the regions : • GRPandits share in total GRP of all the regions has been increasing from 2000: Economy
The growth of fixed assets investment in 2011 hasn’t exceeded the total average levelof RK regions and made up 99.3% compared to previous yearagainst 107.7% of the total in RK. • Fixed assets investment tends to a stable significant growth, however, its values have decreased during the crisis in 2009: • The share of fixed assets investment in the Kazakhstan’s level of investment has increased from 6.2% in 2000 to 7.4% in 2011: Investment
The volume of agriculture production was increasing till 2008, decreased in 2009. In 2010 production volume was 4.4 billion Tenge: • The share of the region’s volume of production in agriculture in total Kazakhstan’s volume of industry’s production. In 2010 0.3% of country’s agricultural production was manufactured in the region: Agriculture
The rowthof industrial production volumes was observed throughout the study period, excluding crisis year 2009, when the mining industry showed the decrease: • Real sector industries with the highest values of production in 2010 are crude oil and natural gas production, construction,other mining industries,maintenance in mining industry, production of finished metal productsother than machine and equipment and etc.These industries have the significant share in the total production volume of RK andregion’s GRP: • The share of industrial production in the Kazakhstan’s level increased from 11% in 2000 to 13% in 2011: Real Sector
Sector Enterprises • The number of industrial enterprises and its share in RK level are growing: • The number of construction companies is increasing: • The number of working agricultural enterprises was falling from 2002 to 2009, in 2011 it has grown up to 32:
Small and Medium Business • The number of registered legal entities as of October 1, 2012 is 10307. The SME number is 10223. The structure of the enterprises number is close to the RK average level: • SME share of the region's GRPis growing steadily, however, it’s significantly below the average in RK:
Interbudgetary Relations • Budget revenues of Mangistau region in 2011 amounted to 104.8 trillion Tenge, including 31.8 trillion Tenge of transfers from the national budget. Expenses amounted to 104.5 trillion Tenge, including 13.4 trillion Tenge of transfers to the national budget. Thus, the region is subventional:
Main target indicators: • GRPincrease in real terms by 29.3% in 2015 compared to 2009. • The share of manufacturing industry in GRP shall be 8.2% in 2015; • The labor productivity in the manufacturing industry shall increase by 1.9 times in 2015 compared to 2009; • The volume of investment in fixed assets in 2011 - 2015 shall be 3096256.2 million Tenge; • An increase of the oil production volume index by 19.9% in 2015 compared to 2009 level; • An increase of the natural gas production volume index by 12.4% in 2015 compared to 2009 level; • An increase of the volume index of refined petroleum products by 2.9 times in 2015 compared to 2009; • The share of the construction materials of local production in the total consumption shall be 17.7% in 2015 ; • An increase of gross production of the chemical products by 2.7 times in 2015 compared to 2009; • GVA growth in the machine industry by 62% in 2015 compared to 2009; • An increase of the labor productivity in the machine industry to 52 thousand dollars per year; • An increase of the GVA of metallurgy by 10.1 times in 2015 compared to 2009; • An increase of SMEs share in GRP in 2015 to 14.9%; • Reduce operating costs of registering and doing business by 30% by 2015 compared to 2011; • Overall mortality to be 5.3 per 1,000 population by 2015; • Life expectancy of the population to be 69 years in 2015 ; • Coverage of preschool education and upbringing of the total number of pre-school children in 2015 - 76.7% (2009 - 35%) • The unemployment rate in 2015 to be 5.5%; • The share of the population with income below the minimum cost of living in 2015 - 19.0%; • The share of alternative energy sources in total energy consumption by 2015 to be 3.29%; • Energy intensity of GDP by 2015 shall decrease by at least 10%; • Pollutant emissions by 2015 to be 110.0 thousand tons. Mangistau Region Development Program for 2011-2015