Download

1 / 43
430 likes | 465 Vues
Comprehensive analysis of workforce and residents in Downtown Tampa in 2008, highlighting demographics, habits, and market potential.

E N D
Tampa Downtown Partnership Market Snapshot Workforce & Residents
Objectives • To establish a base point for measuring progress in the development of the downtown market area. • To better understand the expectations, priorities and obstacles in Downtown Tampa achieving its potential. • To develop a solid base of quantitative information to share with those individuals considering and/or participating in the development of the Downtown Tampa.
Methodology: Two StudiesDesigned to be parallel but not identical, by design • Downtown Workforce • An Internet based study provided to downtown workforce through employers, on-site distribution of invitations and incentives for participation. • Sample target approximately 50,800 workers (SSD Area) • Respondents 1,074 (statistically reliable sample) • Downtown Residents • An Internet based study utilizing a postal invitation to participate with incentives. Mailed to all US Post Office residential addresses. • Sample target approximately 4,900 (SSD Area) • Respondents 212 (statistically reliable sample)
Methodology • Funding: This study was funded primarily through The Tampa Downtown Partnership with assistance from participating members and specific support from HCP & Associates, Inc. The on-going program includes data collection, field implementation, interviews with residents and business entities, and interpretation of data over a twelve month period. This study release is the first installment of information obtained under this market evaluation initiative.
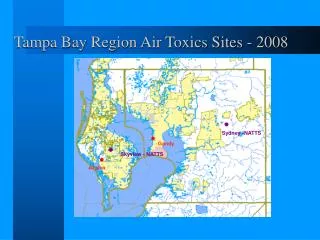
Concept Review/Interview Areas Source: MPO; US Census 2000 with 2006 draft TAZ data
Notes on Interpretation • It is inappropriate to compare this study to any prior studies, due to changes in the market and collection methodologies. In reality, we view this presentation as a “statement in time.” Interpretations of better or worse evaluation from the past or any conclusions on the overall progress in downtown would not be appropriate. Future studies utilizing this model will track changes. • The Tampa Downtown Partnership is based on a SSD which includes the core downtown area. However in reviewing downtown potential and use, the near markets (walking distance and shopping priority districts---Greater CBD) are included to properly reflect the downtown marketplace. • For purposes of this specific study, the impact of The University of Tampa and its students/staff is not included in the data collected---but will be studied separately in an independent activity at a later date.
Residential: Demography Age Gender Household Income • The majority (96.4%) of these Downtown Tampa residents consider their current downtown residence their primary residence.
Residential: Demography • Responses came from various regions of the Downtown Tampa Area. • Condominiums and lofts dominate the residential marketplace. • Over 74.5% of all respondents own their current residence.
Residential: Nesting Evaluation • 62.0% of all respondents have lived in the Tampa Bay Area more than 6 years. • 72.1% of all respondents have lived in their current urban address less than four years—27.9% less than one. Time in Tampa Bay Area Time in Current Downtown Tampa Residence
Downtown Tampa Residential: Previous Residence • Distribution of previous residences reflects a dispersion throughout Tampa DMA • Among those who have moved from outside the state, the Northeast US dominates.
Residential: Involved in Community • Community involvement extends to season tickets and memberships Members & Season Ticket Holders
Residential: Involved in Community • Residents take advantage of downtown attractions • Top attractions: • Channelside Bay Plaza 95.1% • Tampa Bay Performing Arts Center 68.8% • St. Pete Times Forum Events (non-hockey) 63.5% • Tampa Theatre 62.9% • Lightning Hockey Games 62.1% • St. Pete Times Forum concerts 61.8% • Tampa Convention Center events 58.4% • Tampa Bay Buccaneer football games 56.4% • The Florida Aquarium 55.4%
Residential: Shopping Patterns • Monthly shopping patterns—residents frequent local malls and shopping facilities Shopping Centers Visited Past 30 Days
Residential: Frequency of Use • Frequency of use for various entertainment, retail, health and general services Frequency of Use for Various Services
Residential: Habits and Practices Categories Residents Would Use if More Available in Downtown Tampa Residential respondents reflected on areas where their utilization would grow concurrent with increased availability
Residential: A Short Commute • 74.9% of residents either drive or carpool • Majority work outside of Downtown Tampa • Management/Professional categories dominate. Location of Employment Occupation Length of Work Commute
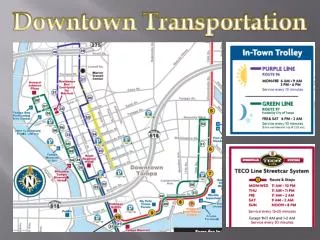
Residential: Transportation • The top three transportation alternatives with highest satisfaction were: • TECOline streetcar • Rubber wheeled trolleys • Rental cars availability • The top three areas with greatest need for improvement were: • Bicycling • Parking • Shuttle Service/TIA
Residential: Motivating Factors • Top 10 reasons to move to downtown ranked by percentage of respondents who considered each to be a motivating factor. Ranked Motivations that Brought Residents to Downtown Tampa
Residential: Expectations • Respondent satisfaction with areas of greatest importance in moving to downtown: Level of Satisfaction by Downtown Residents on Various Categories: Were expectations met or not?
Workforce: Demography Age Gender Household Income
Workforce: Demography • Respondent represented a diverse sampling of the marketplace: • Professional (46.1%) • Public service/government (20.9%) • Sales (7.3%) • Non-Profit related (6.5%), • Media/Communications (2.3%) • Service/construction (1.5%) • Medical (0.7%) • Other/non classified (14.6%)
Workforce: Study Overview • Of total respondents, 79.1% indicated their primary work location was in the Downtown Core. • 58.6% of respondents have worked in downtown for 4 or more years. Time Worked in Downtown Tampa
Downtown Tampa Workforce: Nesting Evaluation • Highest current residence • was dominated by zip codes 33511, 33602, 33606 and 33611…..but the distant Carrollwood, South County and the New Tampa areas • are highly represented
Workforce: Commute • 90.9% drive to work, either alone or in a carpool. • Average commute is more than 15 minutes with 45.7% requiring 30 minutes or longer Length of Commute Means of Getting to Work
Workforce: InTown Transport Issues • Parking/Transportation subsidies • -- 46.7% receive parking subsidy • Respondents in town transportation • 90.3 % by foot and 52.1% by personal car Parking Subsidies Offered by Employer Getting Around Downtown
Workforce: Transportation Satisfaction • The top three transportation topics with highest satisfaction were : • TECOline streetcar • Rubber wheeled trolleys • Public buses • The top three areas noted for improvement were: • Parking, • Bicycling • Rental cars
Workforce: Perceived Progress • Respondents report their perceptions of the progress being made in downtown: Perceptions of Progress in Downtown Tampa
Workforce: Residential Interest • Majority currently own home (81.7%) • Strong dichotomy in downtown residential interest • 12.5% very interested, and 48.4% not interested at all. • Of those who are highly interested -Even distribution of males and females -66.6% are between ages of 25-44 -54.0% have HHI over $75k -64.3% own home -Dominated by South Tampa residents; North Tampa second Interest in Living Downtown in Next 5 Years
Workforce: Involved in Community • Employees take advantage of downtown attractions— • Top attractions: • Channelside Bay Plaza 84.5% • St. Pete Times Forum 80.6% • Tampa Bay Performing Arts Center 71.9% • The Florida Aquarium 58.4% • Lykes Gaslight Square Park 58.3% • Tampa Convention Center 57.9% • Tampa Theatre 49.7%
Workforce: InTown Activities Reported Monthly Activity Participation in the Downtown Market Area: • Downtown participation in services and merchant activity
Workforce: InTown Events • Employee participation was strong for many downtown events Reported Participation in Key Events in Downtown Markets (12 months):
Workforce: Habits and Practices • Respondents were given choices related to their potential to increase participation based on more availability. The areas which stood out included: Categories Employees Would Use if More Available in Downtown Tampa
Observations and Conclusions • Downtown is maturing as a residential location and is rapidly becoming a classic “urban” destination for residents and workers. • The combined audience of the downtown workforce and residents is making a huge difference in the vitality of downtown attractions and facilities. • The opportunities for new businesses and expanded social activities in downtown are substantial. The audience is currently actively engaged and is “demanding” additions in many key areas. • The residents of downtown are active, engaged and opinionated about their city and its future.
Observations and Conclusions • Downtown is not without some areas of concern. • Expectations are somewhat higher than deliveries in the eyes of those already moving to downtown. • They are using facilities but want/need more • Transportation and parking are not meeting the needs in the eyes of those most likely to use the facilities. • The number of restaurants (casual and formal) are far short of the desire/utilization requests of the current $50K plus “participants” in the daily downtown marketplace. • Retail shopping is nearly non-existent, yet highly desired by the occupants. • Traffic (and congestion) while better for some, has declined in the eyes of many.
Observations and Conclusions • We asked about interest and intended participation in downtown enhancements---The list of desires is understandably high and reflects potential utilization in the future. Key elements noted below: Top 5 Downtown Enhancements Respondents Reported Being Likely to Attend
Observations and Conclusions • Expressed concerns (verbatim summary) Open-Ended Responses From Residents and Employees Concerning Downtown Tampa
Future Studies • University of Tampa: Our expectation is to replicate this study with the students and faculty of the University of Tampa to expand or understanding of the retail/market interest dynamics. • Personal Interviews/Focus Groups: We will be expanding our understanding of the verbatim responses through more direct communications with both residents and workers. • Repeat Studies: Repeating this study periodically (anticipate every other year) will let us track the changes and the emerging opportunities/issues. • Data Accumulation: Combined with visitor information studies and with census data, postal delivery studies and a variety of public and private enterprise data fields, we will be shaping an expanded picture of the downtown marketplace and its evolution.
Data Available • We will be providing copies of the PowerPoint for those interested in the findings. • Further evaluation will be ongoing as we delve into the numbers related to special interest groups and specific topics of importance.