Download
1 / 15
160 likes | 187 Vues
Learn how first and second derivatives influence a graph's shape by indicating increase/decrease intervals and concavity changes. Explore tests for local maxima/minima using 1st and 2nd derivatives. Understand inflection points and concavity tests in graphical analysis.

E N D
How derivatives affect the shape of a graph(Section 3.3) Alex Karassev
First and second derivatives • f ′ tells us about intervals of increase and decrease • f ′′ tells us about concavity
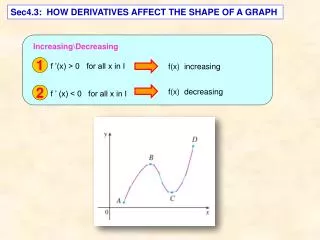
First derivative: Intervals of Increase / Decrease
Increasing / Decreasing Slope of tangent line slope > 0 y = f(x) slope < 0 x decr. incr.
Increasing / Decreasing Test Derivative f ′ (x) > 0 y = f(x) f ′ (x) < 0 x decr. incr.
Change of behavior • f can change from increasing to decreasing and vice versa: • at the points of local max/min (i.e. at the critical numbers) • at the points where f is undefined f ′ (x) > 0 y = f(x) f ′ (x) < 0 x decr. incr.
Local max/min: 1st derivative test • Let c bea critical number • How do we determine whether it is loc. min or loc. max or neither? loc. max loc. min. y = f(x) f ′ (x) < 0 f ′ (x) > 0 c incr. decr. x • If f ′ changes from negative to positive at c, it is loc. min. • If f ′ changes from positive to negative at c, it is loc. max. • If f ′ does not change sign at c, it is neither (e.g. f(x) = x3, c =0)
Second derivative: Concavity
Concavity: definition Graph lies above tangent lines: concave upward Graph lies below tangent lines: concave downward
Concavity: example Inflection points y = f(x) down up up down up
Concavity test: use f′′ f′′ (x) < 0 f′′ (x) > 0 Graph lies above tangent lines: concave upward Graph lies below tangent lines: concave downward Inflection points:Numbers c where f′′(c) = 0 are "suspicious" points
Change of concavity • f can change from concave upward to concave downward and vice versa: • at inflection points (check f ′′ (x) = 0) • at the points where f is undefined y = f(x) down up up down up
Local max/min: 2nd derivative test • Suppose f ′ (c) = 0 • How do we determine whether it is loc. min or loc. max or neither? loc. max f ′′ (c) < 0 loc. min. y = f(x) NOTE: tangent line at (c,f(c))is horizontal f ′′ (c) > 0 c x • If f ′′ (c) > 0 the graph lies above the tangent ⇒loc. min. • If f ′′ (c) < 0 the graph lies below the tangent ⇒loc. max. • If f ′′ (c) = 0 the test is inconclusive (use 1st deriv. test instead!)
Comparison of 1st and 2nd derivative tests for local max/min • Second derivative test is faster then 1st derivative test (we need to determine where f′(c) = 0 and then just compute f′′(c) at each such c) • Second derivative test can be generalized on the case of functions of several variables • However, when f′′(c) = 0, the second derivative test is inconclusive (for example, (0,0) is an inflection point for f(x) = x3, while for x4 it is a point of local minimum, and for –x4 it is a point of local maximum)
Examples • Sketch the graph of function y = x4 – 6x2 • Use the second derivative test to find points of local maximum and minimum off(x) = x/(x2+4)