Download
1 / 70
760 likes | 1.03k Vues
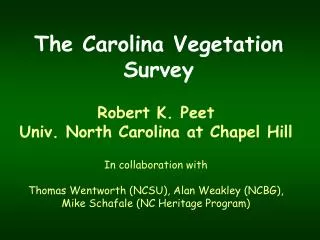
The Carolina Vegetation Survey. Robert K. Peet Univ. North Carolina at Chapel Hill In collaboration with Thomas Wentworth (NCSU), Alan Weakley (NCBG), Mike Schafale (NC Heritage Program). Carolina Vegetation Survey.

E N D
The Carolina Vegetation Survey Robert K. Peet Univ. North Carolina at Chapel Hill In collaboration with Thomas Wentworth (NCSU), Alan Weakley (NCBG), Mike Schafale (NC Heritage Program)
Carolina Vegetation Survey Multi-institutional collaborative study to document and understand the natural vegetation of the Carolinas. High-quality, quantitative records of natural vegetation
Why CVS? • Description, classification, and analysis of the natural vegetation of the Carolinas • Determine attributes of individual taxa • Inventory • Targets for restoration • Long-term monitoring – both natural and modified lands • It’s fun
The NCVS Protocol • Consistent methodology • Appropriate for most vegetation types • FGDC compliant • Scale transgressive • Flexible in intensity of use and commitment of time (Levels 1-5) • Easily resampleable • Total floristics • Tree population structure • Major site variables, including soil attributes
The Pulse Approach • Based on community collaboration • Provides training & experience • Intense regional focus for one week • “Bootcamp for botanists” • “Botanical Woodstock” • “Extreme botany”
NCVS Report Card • Pulses events: 19 years (1-2/yr) • Numerous affiliated projects • Volunteer participants: > 600 • Total plots: > 6000 • Total species: > 3000 • Total vegetation types: > 200
Results: Species frequencies2628 of 4073 species, 4956 plots, 194331 occurrences
Top 5 species in 4955 plots • 63% Acer rubrum (Red Maple) • 39% Smilax glauca (Whiteleaf Greenbrier) • 38% Smilax rotundifolia (Common Greenbrier) • 36% Nyssa sylvatica (Black Gum) • 36% Quercus rubra (Red Oak)
Top 7 species: 652 Coastal Plain forest plots • 48% Toxicodendron radicans (Poison-ivy) • 44% Acer rubrum (Red Maple) • 44% Parthenocissus quinquefolia (Virginia-creeper) • 41% Vitis rotundifolia (Muscadine) • 41% Liquidambar styraciflua (Sweetgum) • 35% Smilax rotundifolia (Common Greenbrier) • 34% Smilax bona-nox (Catbrier) (15 of the top 50 are vines)
Who is missing? • Rare species • Weeds of fields and waste places • Plants of marshes and wetlands • Plants of special habitats
Occurrences of Carolina Milkweeds**=rare, *=uncommon (Weakley 2006)
Xeric barrens & Subxeric uplands: Longleaf – turkey oak woodlands on entisols 9 Types13 Types
Flatwoods: Longleaf woodlands of spodosols 5 types
Silty uplands: Longleaf woodlands on well-drained ultisols 12 types
Savannas and seeps: Longleaf woodlands on moist alfisols 13 types
Ecological Groups Mountain Vegetation • Montane upland forests • Montane open upland vegetation • Montane alluvial wetland vegetation • Montane nonalluvial wetland vegetation Piedmont Vegetation • Piedmont upland forests • Piedmont open upland vegetation • Piedmont alluvial wetland vegetation • Piedmont nonalluvial wetland vegetation Coastal Plain Vegetation • Coastal Plain upland forests • Coastal Plain upland open & woodland vegetation • Coastal Plain alluvial wetland vegetation • Coastal Plain nonalluvial wetland vegetation Coastal Fringe Vegetation • Maritime upland forests & shrublands • Maritime open upland vegetation • Maritime nontidal wetland vegetation • Tidal wetland vegetation http://cvs.bio.unc.edu
Classic Restoration strategy • Document reference conditions • Derive restoration targets • Design site-specific restoration plan • Implement the plan • Monitor change and assess success • Employ adaptive management
North Carolina Ecosystem Enhancement Program “The EEP mission is to restore, enhance, preserve and protect the functions associated with wetlands, streams, and riparian areas, including … restoration, maintenance and protection of water quality and riparian habitats …”
Ecosystem Enhancement Program Biennial Budget FY 2005/06 and 2006-07 Cost by Category: Total $175,077,880 Summary Administration $ 9,477,939 Restoration* $ 102,910,770 HQ Preservation $ 57,984,804 Project Development $ 4,704,366 *Includes Implementation and Biennial Total $ 175,077,880 Future Mitigation Projects
Stream Restoration Durham, NC
Traditional EEP method • Consult brief habitat-based plant lists • Design a site-specific restoration plan • Implement the plan • Monitor survival of planted stems 5 yrs • Replant if needed
EEP-CVS Collaboration • EEP wants to do a better job creating natural ecosystems. • CVS provides improved reference data, target design, monitoring, and data management and analysis
Target generation • Simple goal – Deliver composition goal based on the vegetation type most appropriate for the site and region. • Sophisticated goal – Automated system that uses site information and reference plot data to predict vegetation composition.
Longleaf pine – feasibility study • Few longleaf pine sites remain in “original” condition. • Restoration targets must be extrapolated from a limited number of reference stands.
Dataset: • 188 plots across fall-line sandhills of NC, SC, & GA • - All sites contained near-natural, fire-maintained groundlayer vegetation • - Soil attributes included for both the A and B horizon: sand, silt, clay, Ca, Mg, K, P, S, Mn, Na, Cu, Zn, Fe, BD, pH, organic content, CEC, BS.
Step 1. Classification. Developed a classification of the major vegetation types of the ecoregion. Used cluster analysis with a matrix of 188 plots x 619 species. Vegetation types were seen to be differentiated with respect to soil texture, moisture, nutrient status, & geography.
Step 2. Build model. • - Forward selection with linear discriminant analysis identified predictor variables. • Critical variables were Latitude, Manganese, Phosphorus, Clay, Longitude. • 75% of plots correctly identified to vegetation series. Typically 75% of plots within a series were correctly classified to community type.
Step 3. Select species. • Generate a list of all species in type (species pool) with frequency, mean cover values, and mean richness. • Randomly order the list • Compare species frequency to random number between 0 & 1, and if the random number is less than the proportion of plots the species is selected. Continue until the number in list of selected species equals the number predicted.
Summary of overall strategy: • Identify biogeographic region and obtain predictive models. • Select pool of candidate species for a specific site based on range information. • Divide restoration site into environmentally homogenous areas, stratifying by topography and soil. • Use models to select species number and composition.
Trade off between detail and time. • EEP protocol seamlessly integrates with CVS methods by allowing a series of sampling levels. • MS-Access data-entry tool to assure standardize data, easy assimilation, and automated quality control. • Backend database used for reports and analysis
Reports & Analysis • Datasheets for monitoring • Survival & growth of planted stems • Direction of compositional change • Rate of change • Problems needing attention, such as exotic species
Information Infrastrustructure and Biodiversity Databases “ … ecology is a science of contingent generalizations, where future trends depend (much more than in the physical sciences) on past history and on the environmental and biological setting.” Robert May 1986
Major new data sources • Site data: climate, soils, topography, etc. • Taxon attribute data:identification, phylogeny, distribution, life-history, functional attributes, etc. • Occurrence data: attributes of individuals (e.g., size, age, growth rate) and taxa (e.g., cover, biomass) that occur or co-occur at a site.
Locality Observation/ Collection Event Observation database Specimen or Object Occurrence database Bio-Taxon Taxonomic database Biodiversity data structure Observation or Community Type Observation type database
VegBank • VegBank is a public archive for vegetation plot observations (http://vegbank.org). • VegBank is expected to function for vegetation plot data in a manner analogous to GenBank. • Primary data will be deposited for reference, novel synthesis, and reanalysis. • The database architecture is generalizable to most types of species co-occurrence data.
Opportunities • Theoretical community ecology. Which taxa occur together, and where, and following what rules? • Remote sensing. What is really on the ground? • Monitoring. What changes are really taking place in the vegetation? • Restoration. What should be our restoration targets? • Vegetation & species modeling. Where should we expect species & communities to occur after environmental changes?
Biodiversity informatics depends on accurate and precise taxonomy • Accurate identification and labelling of organisms is a critical part of collecting, recording and reporting biological data. • Increasingly, research in biodiversity and ecology is based on the integration (and re-use) of multiple datasets.
Taxonomic database challenge:Standardizing organisms and communities The problem: Integration of data potentially representing different times, places, investigators and taxonomic standards. The traditional solution: A standard list of organisms / communities.
Standard lists are available for Taxa Representative examples for higher plants in North America / US USDA Plants http://plants.usda.gov ITIS http://www.itis.usda.gov NatureServe BONAP Flora North America These are intended to be checklists wherein the taxa recognized perfectly partition all plants. The lists can be dynamic.
Taxonomic theory A taxon concept represents a unique combination of a name and a reference. Report -- name sec reference. . Name Concept Reference
One concept ofAbieslasiocarpa USDA Plants & ITIS Abies lasiocarpa var. lasiocarpa var. arizonica
A narrow concept of Abies lasiocarpa Flora North America Abies lasiocarpa Abies bifolia Partnership with USDA plants to provide plant concepts for data integration
Relationships among conceptsallow comparisons and conversions • Congruent, equal (=) • Includes (>) • Included in (<) • Overlaps (><) • Disjunct (|) • and others …