Download
1 / 4
40 likes | 179 Vues
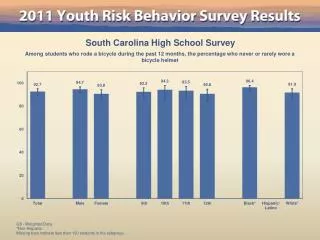
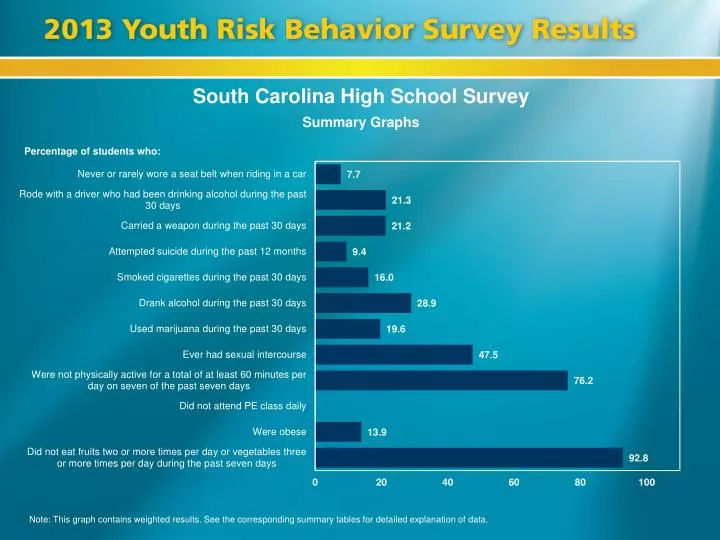
South Carolina High School Survey. Summary Graphs. Percentage of students who:. Note: This graph contains weighted results. See the corresponding summary tables for detailed explanation of data. . South Carolina High School Survey. Summary Graphs. Percentage of students who:.

E N D
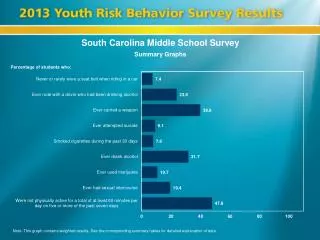
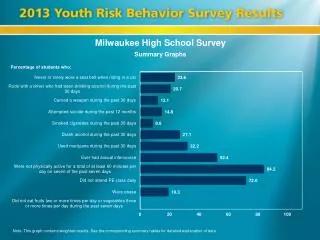
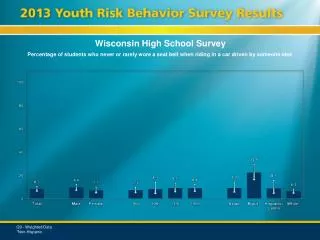
South Carolina High School Survey Summary Graphs Percentage of students who: Note: This graph contains weighted results. See the corresponding summary tables for detailed explanation of data..
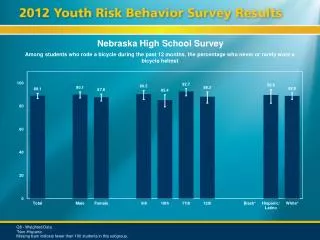
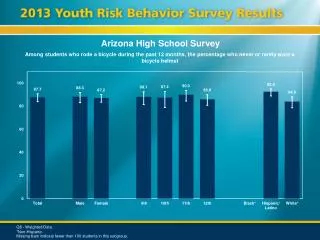
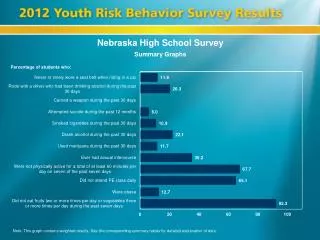
South Carolina High School Survey Summary Graphs Percentage of students who: Note: This graph contains weighted results. See the corresponding summary tables for detailed explanation of data..
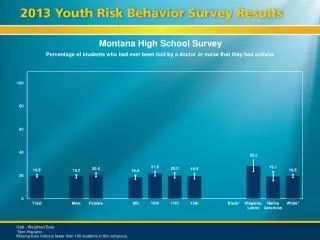
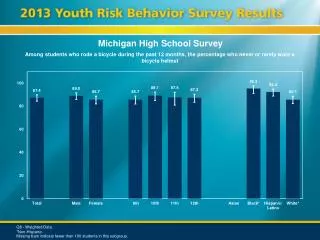
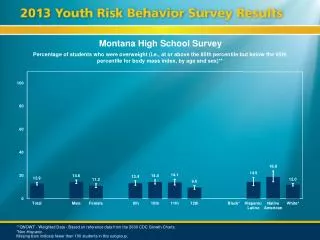
South Carolina High School Survey Summary Graphs Number of students in a class of 30 who: Note: This graph contains weighted results. See the corresponding summary tables for detailed explanation of data.
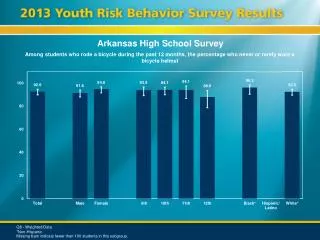
South Carolina High School Survey Summary Graphs Number of students in a class of 30 who: Note: This graph contains weighted results. See the corresponding summary tables for detailed explanation of data.