Download
1 / 35
350 likes | 485 Vues
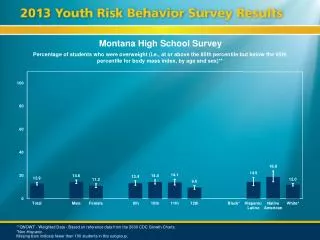
Montana High School Survey. Percentage of students who were overweight (i.e., at or above the 85th percentile but below the 95th percentile for body mass index, by age and sex)**. **QNOWT - Weighted Data - Based on reference data from the 2000 CDC Growth Charts. *Non-Hispanic.

E N D
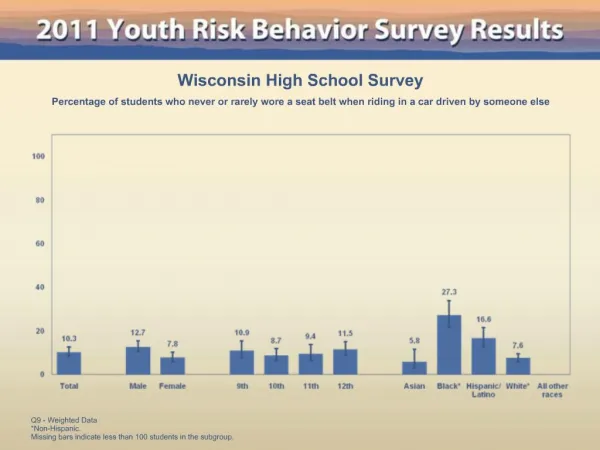
Montana High School Survey Percentage of students who were overweight (i.e., at or above the 85th percentile but below the 95th percentile for body mass index, by age and sex)** **QNOWT - Weighted Data - Based on reference data from the 2000 CDC Growth Charts. *Non-Hispanic. Missing bars indicate fewer than 100 students in this subgroup.
Montana High School Survey Percentage of students who were obese (i.e., at or above the 95th percentile for body mass index, by age and sex)** **QNOBESE - Weighted Data - Based on reference data from the 2000 CDC Growth Charts. *Non-Hispanic. Missing bars indicate fewer than 100 students in this subgroup.
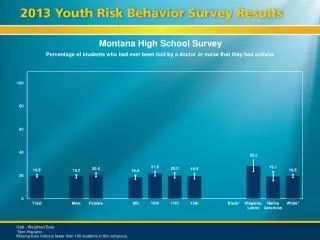
Montana High School Survey Percentage of students who described themselves as slightly or very overweight Q66 - Weighted Data *Non-Hispanic. Missing bars indicate fewer than 100 students in this subgroup.
Montana High School Survey Percentage of students who were trying to lose weight Q67 - Weighted Data *Non-Hispanic. Missing bars indicate fewer than 100 students in this subgroup.
Montana High School Survey Percentage of students who went without eating for 24 hours or more to lose weight or to keep from gaining weight during the past 30 days Q68 - Weighted Data *Non-Hispanic. Missing bars indicate fewer than 100 students in this subgroup.
Montana High School Survey Percentage of students who took any diet pills, powders, or liquids without a doctor's advice to lose weight or to keep from gaining weight during the past 30 days Q69 - Weighted Data *Non-Hispanic. Missing bars indicate fewer than 100 students in this subgroup.
Montana High School Survey Percentage of students who vomited or took laxatives to lose weight or to keep from gaining weight during the past 30 days Q70 - Weighted Data *Non-Hispanic. Missing bars indicate fewer than 100 students in this subgroup.
Montana High School Survey Percentage of students who drank 100% fruit juices one or more times during the past seven days Q71 - Weighted Data *Non-Hispanic. Missing bars indicate fewer than 100 students in this subgroup.
Montana High School Survey Percentage of students who ate fruit one or more times during the past seven days Q72 - Weighted Data *Non-Hispanic. Missing bars indicate fewer than 100 students in this subgroup.
Montana High School Survey Percentage of students who ate green salad one or more times during the past seven days Q73 - Weighted Data *Non-Hispanic. Missing bars indicate fewer than 100 students in this subgroup.
Montana High School Survey Percentage of students who ate potatoes one or more times during the past seven days Q74 - Weighted Data *Non-Hispanic. Missing bars indicate fewer than 100 students in this subgroup.
Montana High School Survey Percentage of students who ate carrots one or more times during the past seven days Q75 - Weighted Data *Non-Hispanic. Missing bars indicate fewer than 100 students in this subgroup.
Montana High School Survey Percentage of students who ate other vegetables one or more times during the past seven days Q76 - Weighted Data *Non-Hispanic. Missing bars indicate fewer than 100 students in this subgroup.
Montana High School Survey Percentage of students who ate fruits and vegetables five or more times per day during the past seven days QNFRVG - Weighted Data *Non-Hispanic. Missing bars indicate fewer than 100 students in this subgroup.
Montana High School Survey Percentage of students who ate fruits or drank 100% fruit juices two or more times per day during the past seven days QNFRUIT - Weighted Data *Non-Hispanic. Missing bars indicate fewer than 100 students in this subgroup.
Montana High School Survey Percentage of students who ate fruits or drank 100% fruit juices 0 times per day during the past seven days QNFR0 - Weighted Data *Non-Hispanic. Missing bars indicate fewer than 100 students in this subgroup.
Montana High School Survey Percentage of students who ate fruits or drank 100% fruit juices one or more times per day during the past seven days QNFR1 - Weighted Data *Non-Hispanic. Missing bars indicate fewer than 100 students in this subgroup.
Montana High School Survey Percentage of students who ate fruits or drank 100% fruit juices three or more times per day during the past seven days QNFR3 - Weighted Data *Non-Hispanic. Missing bars indicate fewer than 100 students in this subgroup.
Montana High School Survey Percentage of students who ate vegetables three or more times per day during the past seven days QNVEG - Weighted Data *Non-Hispanic. Missing bars indicate fewer than 100 students in this subgroup.
Montana High School Survey Percentage of students who ate vegetables 0 times per day during the past seven days QNVEG0 - Weighted Data *Non-Hispanic. Missing bars indicate fewer than 100 students in this subgroup.
Montana High School Survey Percentage of students who ate vegetables one or more times per day during the past seven days QNVEG1 - Weighted Data *Non-Hispanic. Missing bars indicate fewer than 100 students in this subgroup.
Montana High School Survey Percentage of students who ate vegetables two or more times per day during the past seven days QNVEG2 - Weighted Data *Non-Hispanic. Missing bars indicate fewer than 100 students in this subgroup.
Montana High School Survey Percentage of students who ate fruits or drank 100% fruit juices two or more times per day and ate vegetables three or more times per day during the past seven days QNFRVG2 - Weighted Data *Non-Hispanic. Missing bars indicate fewer than 100 students in this subgroup.
Montana High School Survey Percentage of students who drank a can, bottle, or glass of soda or pop one or more times per day during the past seven days Q77 - Weighted Data *Non-Hispanic. Missing bars indicate fewer than 100 students in this subgroup.
Montana High School Survey Percentage of students who drank a can, bottle, or glass of soda or pop 0 times per day during the past seven days QNSODA0 - Weighted Data *Non-Hispanic. Missing bars indicate fewer than 100 students in this subgroup.
Montana High School Survey Percentage of students who drank a can, bottle, or glass of soda or pop two or more times per day during the past seven days QNSODA2 - Weighted Data *Non-Hispanic. Missing bars indicate fewer than 100 students in this subgroup.
Montana High School Survey Percentage of students who drank a can, bottle, or glass of soda or pop three or more times per day during the past seven days QNSODA3 - Weighted Data *Non-Hispanic. Missing bars indicate fewer than 100 students in this subgroup.
Montana High School Survey Percentage of students who drank three or more glasses per day of milk during the past seven days Q78 - Weighted Data *Non-Hispanic. Missing bars indicate fewer than 100 students in this subgroup.
Montana High School Survey Percentage of students who drank 0 glasses per day of milk during the past seven days QNMILK0 - Weighted Data *Non-Hispanic. Missing bars indicate fewer than 100 students in this subgroup.
Montana High School Survey Percentage of students who drank one or more glasses per day of milk during the past seven days QNMILK1 - Weighted Data *Non-Hispanic. Missing bars indicate fewer than 100 students in this subgroup.
Montana High School Survey Percentage of students who drank two or more glasses per day of milk during the past seven days QNMILK2 - Weighted Data *Non-Hispanic. Missing bars indicate fewer than 100 students in this subgroup.
Montana High School Survey Percentage of students who ate breakfast on all of the past seven days Q79 - Weighted Data *Non-Hispanic. Missing bars indicate fewer than 100 students in this subgroup.
Montana High School Survey Percentage of students who ate breakfast on none of the past seven days QNNOBKFT - Weighted Data *Non-Hispanic. Missing bars indicate fewer than 100 students in this subgroup.
Montana High School Survey Percentage of students who drank a can, bottle, or glass of diet soda or pop, such as Diet Coke, Diet Pepsi, or Sprite Zero, one or more times per day during the past seven days Q96 - Weighted Data *Non-Hispanic. Missing bars indicate fewer than 100 students in this subgroup.
Montana High School Survey Percentage of students who most of the time or always went hungry during the past 30 days because there was not enough food in their home Q97 - Weighted Data *Non-Hispanic. Missing bars indicate fewer than 100 students in this subgroup.