Montana High School Physical Activity and Screen Time Survey Results
80 likes | 201 Vues
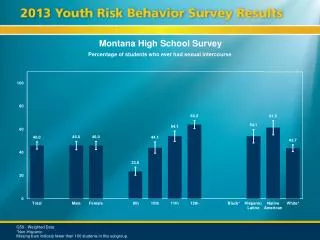
This report presents the findings from the Montana High School Survey, focusing on students' physical activity levels, screen time, and participation in physical education classes. Key metrics include percentages of students engaging in at least 60 minutes of physical activity daily, time spent watching TV and playing video games, and attendance in PE classes. The data highlights trends in health-related behaviors among students, providing insight into their overall wellbeing and engagement in physical activities vs. sedentary pastimes.

Montana High School Physical Activity and Screen Time Survey Results
E N D
Presentation Transcript
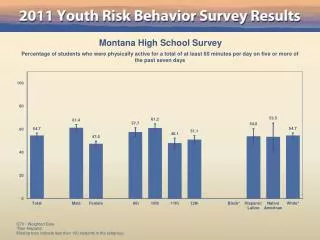
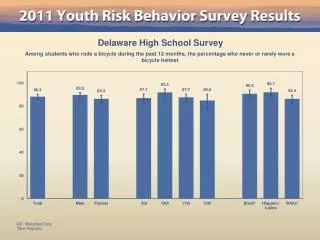
Montana High School Survey Percentage of students who were physically active for a total of at least 60 minutes per day on five or more of the past seven days Q80 - Weighted Data *Non-Hispanic. Missing bars indicate fewer than 100 students in this subgroup.
Montana High School Survey Percentage of students who were physically active for a total of at least 60 minutes per day on 0 of the past seven days QNPA0DAY - Weighted Data *Non-Hispanic. Missing bars indicate fewer than 100 students in this subgroup.
Montana High School Survey Percentage of students who were physically active for a total of at least 60 minutes per day on 7 of the past seven days QNPA7DAY - Weighted Data *Non-Hispanic. Missing bars indicate fewer than 100 students in this subgroup.
Montana High School Survey Percentage of students who watched three or more hours per day of TV on an average school day Q81 - Weighted Data *Non-Hispanic. Missing bars indicate fewer than 100 students in this subgroup.
Montana High School Survey Percentage of students who played video or computer games or used a computer for something that was not school work three or more hours per day on an average school day Q82 - Weighted Data *Non-Hispanic. Missing bars indicate fewer than 100 students in this subgroup.
Montana High School Survey Percentage of students who attended physical education (PE) classes on one or more days in an average week when they were in school Q83 - Weighted Data *Non-Hispanic. Missing bars indicate fewer than 100 students in this subgroup.
Montana High School Survey Percentage of students who attended physical education (PE) classes daily in an average week when they were in school QNDLYPE - Weighted Data *Non-Hispanic. Missing bars indicate fewer than 100 students in this subgroup.
Montana High School Survey Percentage of students who played on one or more sports teams during the past 12 months Q84 - Weighted Data *Non-Hispanic. Missing bars indicate fewer than 100 students in this subgroup.