Download
1 / 4
40 likes | 176 Vues
This summary presents a detailed analysis of the Los Angeles High School survey, highlighting the percentage of students who responded to various questions. The accompanying graphs illustrate the weighted results, providing insights into student opinions and class sizes. Additionally, a specific breakdown reveals the number of students in a class of 30, further supporting the findings. For a thorough understanding of the data and implications, refer to the corresponding summary table, which offers an in-depth explanation of the results.

E N D
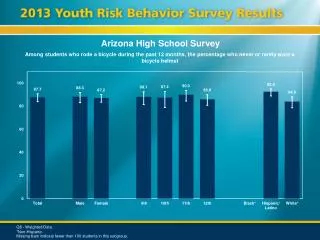
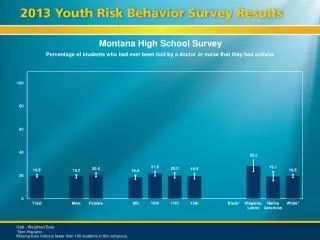
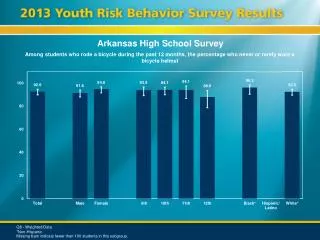
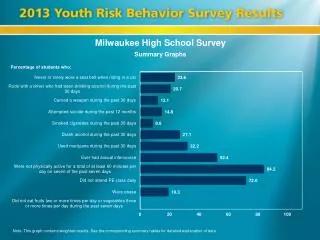
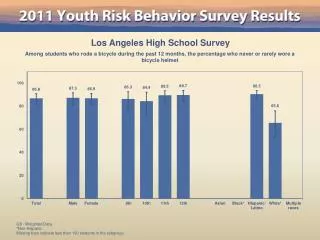
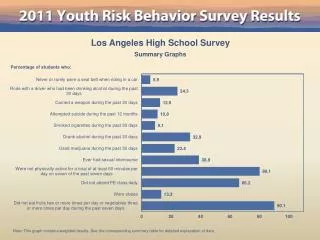
Los Angeles High School Survey Summary Graphs Percentage of students who: Note: This graph contains weighted results. See the corresponding summary table for detailed explanation of data.
Los Angeles High School Survey Summary Graphs Percentage of students who: Note: This graph contains weighted results. See the corresponding summary table for detailed explanation of data.
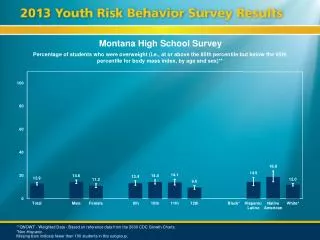
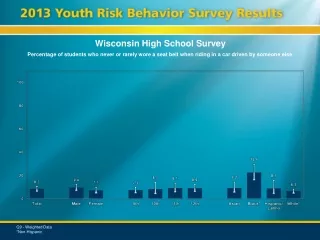
Los Angeles High School Survey Summary Graphs Number of students in a class of 30 who: Note: This graph contains weighted results. See the corresponding summary table for detailed explanation of data.
Los Angeles High School Survey Summary Graphs Number of students in a class of 30 who: Note: This graph contains weighted results. See the corresponding summary table for detailed explanation of data.