Summary of Montana High School Survey Results: Student Participation and Class Sizes
40 likes | 154 Vues
This document presents a concise summary of the Montana High School Survey, showcasing key graphs that illustrate the percentage of students participating in various activities and the number of students in a typical class of 30. The results are weighted for accuracy and provide valuable insights into student engagement and class demographics. Further details and explanations of the data can be found in the associated summary tables, which clarify the context and implications of the findings.

Summary of Montana High School Survey Results: Student Participation and Class Sizes
E N D
Presentation Transcript
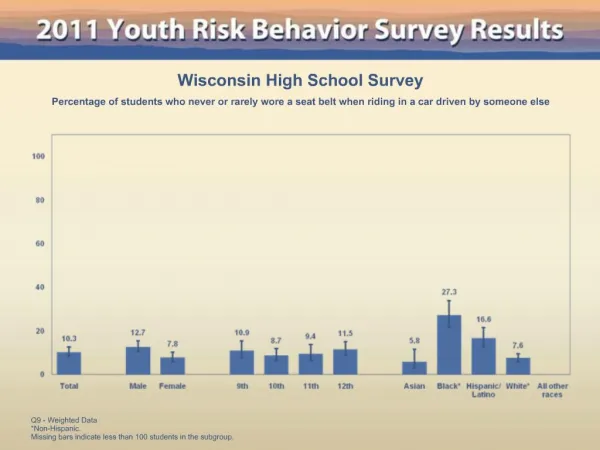
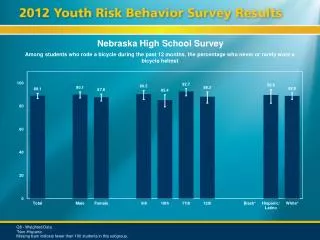
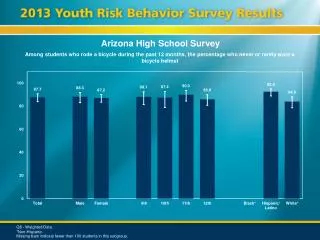
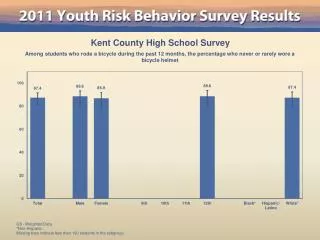
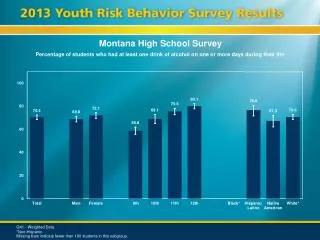
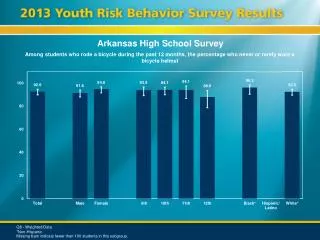
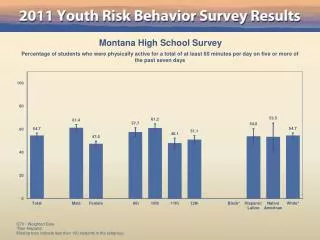
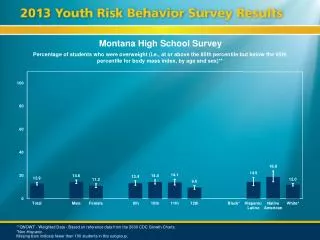
Montana High School Survey Summary Graphs Percentage of students who: Note: This graph contains weighted results. See the corresponding summary tables for detailed explanation of data..
Montana High School Survey Summary Graphs Percentage of students who: Note: This graph contains weighted results. See the corresponding summary tables for detailed explanation of data..
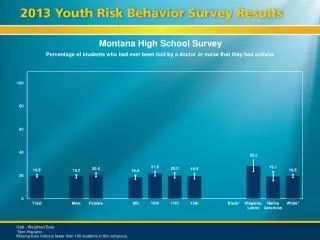
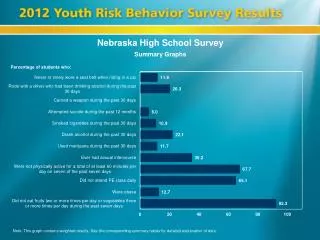
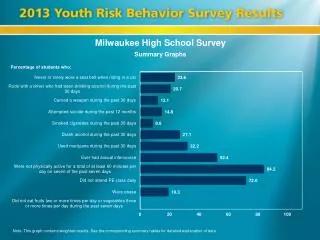
Montana High School Survey Summary Graphs Number of students in a class of 30 who: Note: This graph contains weighted results. See the corresponding summary tables for detailed explanation of data.
Montana High School Survey Summary Graphs Number of students in a class of 30 who: Note: This graph contains weighted results. See the corresponding summary tables for detailed explanation of data.