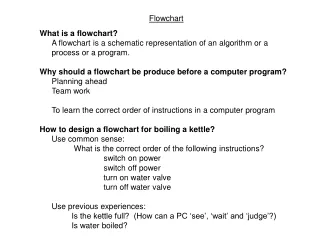
Flowchart Tutorial
Flowchart Tutorial . Example 1:. Draw a flowchart to find the sum of first 50 natural numbers. . start. SUM=0. N=0. N=N+1. SUM=SUM+N. no. IS N==50? . yes. Print SUM. END. Example 2. Draw a flowchart to find the largest of three numbers A, B, and C. . START. READ A,B,C. yes.

Flowchart Tutorial
E N D
Presentation Transcript
Example 1: Draw a flowchart to find the sum of first 50 natural numbers.
start SUM=0 N=0 N=N+1 SUM=SUM+N no IS N==50? yes Print SUM END
Example 2 Draw a flowchart to find the largest of three numbers A, B, and C.
START READ A,B,C yes IS B >C ? no IS A>B ? yes IS A>C ? yes no no PRINT C PRINT A PRINT B END
Example 3 Draw a flowchart for program Find the difference and the division of two numbers and display the result.
START READ N1 , N2 D=N1-N2 V=N1/N2 PRINT D , V STOP
Example 4 Draw a flowchart for program Print the first 10 natural number
start N=1 Print N N=N+1 yes while N <= 10 no END
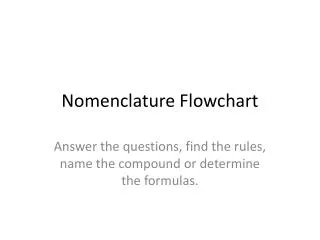
Example 6 Draw a flowchart for program Calculate the student grade ( A,B,C,D,F)
start Read Grade Grade >=90 Print A yes no Grade >=80 Print B yes no Grade >=70 yes Print C no Grade >=60 yes Print D no Print F END
Example 7 Draw a flowchart for program read temperature , If temp > 0 print above freezing else below freezing
start Read Temp Temp >0 yes Print“above freezing” no Print“below freezing” End
Example 8 Draw a flowchart for program read (10) marks for (20) students, then print the average for each student.
START studentCount=0 markCount=0 sUM=0 , avg=0 While studentCount <20 no yes STOP While markCount<10 no avg=sUM/10 yes PRINT avg READ x Increment studentCount sUM=sUM+x Increment markCount avg=0 , sUM=0 markCount=0