Flowchart
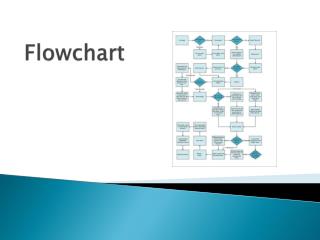
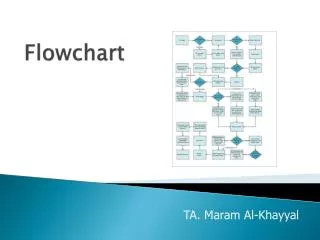
Flowchart. The art of drawing a road map. Symbols. Oval (“racetrack”) Start or Stop (Terminator) Rectangle Process (calculation, value assignment, etc) Rectangle with double vertical sides A predefined process

Flowchart
E N D
Presentation Transcript
Flowchart The art of drawing a road map
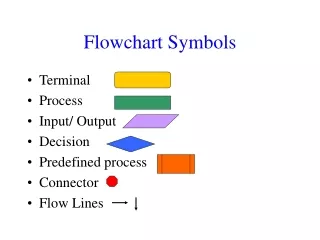
Symbols • Oval (“racetrack”) • Start or Stop (Terminator) • Rectangle • Process (calculation, value assignment, etc) • Rectangle with double vertical sides • A predefined process • Allows you to represent something complicated at an early stage and basically show that “it goes here” in your flow of activity • Rhomboid (slanted rectangle) • Input / output (data) • Diamond • Decision • Arrows indicate direction or “flow” of activity • Small circle (possibly with letter inside) • “on page” continuation • Home Plate • “off page” continuation Start Calculate Avg Perform Tax Calculation Get TempCent Age>21? A AvgGrades
Flowchart • Demonstrates a sequence of activities and decisions • Can be used as a roadmap in writing code • Certain shapes identify code “structures” • Decision structures • A condition which evaluates to True or False • Asks a question which “directs” the continued flow of activity • Repetition structures (loops) • A return to a prior point in the flowchart • NOTE: this return is based on a condition being either true or false • While the shape asking the question is a diamond and could be an “IF” statement, the fact that one of the branches from the diamond returns to a prior point indicates that the conditional question asked is part of a LOOP and not an IF
Flowchart • Forces us to think about what we do • We need to identify each discrete action (process) or question (decision) in order to solve the problem • Flowcharts can identify that we “missed” something • We have a process which calculates “GROSSPAY”, and know that GROSSPAY requires “Hoursworked” and “HourlyPay” as input, but we notice that prior to the calculation, we never bothered to getHoursWorked (missing input) • We’ve calculated a result “NETPAY”, however never display it to the user (output of our solution) • Flowcharts can identify a sequencing error • We display a result prior to calculating it • We can think about things more abstractly • Calculate Grosspay • If we know someone worked 10 hours at $15/hour the calculation is 10 x 15 • NOT abstract enough… it only works for that single case • Work backwards. What does the 10 represent? [ Hoursworked] • Use THAT name to represent any value given
ATM Password Validation • The user gets 3 attempts to provide the valid password • If valid • Go to the process transaction “off-page” routine • If it’s the 3rd failed attempt • Stop! • Decision • “Valid” diamond • Repetition • 3rd attempt question is part of the LOOP, and not simply an IF • How you can identify the difference between which structure to code (IF vs. LOOP)
IF statement / variations • IF blnPass=False If AvgGrade > 65 then blnPass=TRUE • IF ..ELSE..ENDIF If AvgGrade > 65 then blnPass=True Else blnPass = False End If • IF .. ELSEIF… ENDIF If Avg >=90 then LG = “A” ElseIfAvg >= 80 LG = “B” ElseIfAvg >= 70 LG = “C” Else LG = “F” End If
Filling in symbols • Processes • Use a “verb” or action word • Think of each process as its own little “IPO” (Input-Process-Output) • Do you have all of the required inputs to do the process at that point in time? • If not, maybe you missed a step somewhere • Decisions • True or false • Comparison • Age>21 • Counter <= 3 • State • Grade exists?
Slow down! • Draw a flowchart finding the average of 3 grades • How would you do it with paper and pencil? • Take the first grade • Add the 2nd to the first grade • Add the 3rd to that • You’re “accumulating” (totaling) the grades • In English… “I’m adding to the grade total” • After grade total is calculated • Calculate the final average by dividing it by the number of grades (3) • Show the answer
Average of “n” grades • You’ll still do the same process • Except… you don’t now how many grades you have • Count them!!! (GradeCount accumulator) • You’ll keep counting and adding grades until…. • No more grades left (condition in your loop decision) • Maybe ask “no more grades?” (true/false answer) • Additional processes are bolded • Altered decision is bold/dashed
Helpful hints • Don’t keep track of totals in your mind • “Store it” somewhere (write it on paper) • Give it a name (something that represents that value) • If you’re comparing something, like the highest grade • It assumes that you’re keeping track of the last highest grade and comparing the current grade to it • Start off with HighGrade • Assign the lowest possible value to it BEFORE you start to compare the grades you get • This way, the very first grade will be higher • If the current grade is higher than the HighGrade, replace HighGrade
Assignment • Find the average height (in meters) of the students in your class and display the result • Also display the tallest and shortest students’ heights in meters • All measurements are in terms of centimeters • Final result to be displayed in meters (divide cm by 100) • 1 inch = 2.54 cm • Heights vary between 150 and 200 cm • Unknown number of students • Approaches • Find the average for 5 students • When that works, change it to work for unknown number of students • When that works, add the logic to find the tallest and shortest students