Download
1 / 26
260 likes | 373 Vues
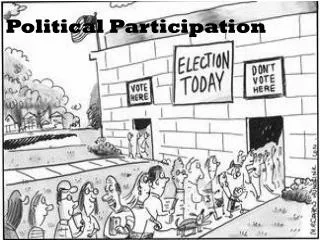
Political Participation. Why Do People Vote? Who Votes? Do We Care?. Homework. Due Thursday, BEGINNING of Class 3-1, 6-6 3-4 for extra credit (worth 20 points) http://elections.gmu.edu/Voter_Turnout_2004.htm. Pre-1990s Scholarship. Two camps Rational choice theorists

E N D
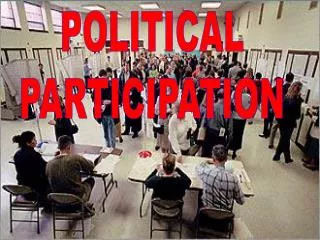
Political Participation Why Do People Vote? Who Votes? Do We Care?
Homework • Due Thursday, BEGINNING of Class • 3-1, 6-6 • 3-4 for extra credit (worth 20 points) • http://elections.gmu.edu/Voter_Turnout_2004.htm
Pre-1990s Scholarship • Two camps • Rational choice theorists • “Demographic predictor” researchers
Anthony Downs, “An Economic Theory of Democracy” (1957) • People vote if (P*B) – C > 0
Good theory, bad prediction • “Predicts” that rational people never vote • Possible “fix” • Focus on different benefits . . . Psychic benefits, “duty” • Turnout not always sensitive to changes in costs • National Voter Registration Act (Motor Voter Act) of 1993) increased registration but not turnout • BUT what about effects of “same day registration”?
2004 Total Turnout Rates for Voting Eligible Population • Minnesota: 77.21% • Wisconsin: 76.19% • Maine: 73.37%
Possible explanations: Law High Turnout Law Civic Culture High Turnout
Other Camp • Demographic people are able to predict behavior based on characteristics • Education • SES • Race • Age • But, they don’t really explain why people vote (description rather than explanation)
So . . . • One camp is developing explanations that don’t do a good job of describing actual behavior • The other camp is developing descriptions but not bothering to explain the “why” question
Civic Voluntarism Model • Henry Brady, Sidney Verba and Kay Lehman Schlozman • “Voice and Equality”
Civic Voluntarism Model • Interest/Engagement • Mobilization/Recruitment • Resources
Interest/Engagement • interest in politics • political efficacy (“I can make a difference, I can participate effectively”) • sense of civic duty (“It’s my job as an American to participate”) • group consciousness (“As my community goes, so go I”) • party identification • commitment to personal issues
Mobilization/Recruitment • Being asked to participate • What increases chances of recruitment?
Resources • Time • Money • “Civic skills” • Organizational skills • Language skills • Social adeptness • What increases resources?
Note . . . • Some demographic characteristics can cut both ways • Example: having children • May increase interest/engagement • May decrease resources
Implications for Civic Voluntarism Model • “Equal opportunity” not all that equal • Importance of social capital and group membership • Importance of “political entrepreneurs” – politicians and groups that mobilize people • Importance of childhood experiences (family life, education) in adult political behavior
Barriers to ParticipationFormal • Voter Eligibility • Registration laws • Campaign finance laws • Number / quality of polling places
Barriers to ParticipationInformal • Lack of money • Lack of time • Lack of knowledge • Language barriers • Lack of “social capital”
Participation: The Big Picture • 2004: 55% of “Voting Age Population” actually voted (highest since 1968) • 2002: 37% of “Voting Age Population” actually voted • Numbers somewhat misleading • “VAP” includes all adults, even those who are ineligible to vote. • In fact, 63.8% of the CITIZEN population voted in 2004
Turnout • Declining over past 50 years • Why? • Do we care?
Turnout in 2004 - Gender • Men (citizens): 62.1% • Women (citizens): 65.4%
Demographics of Participation • Higher education • Higher SES • Higher age • Cohort Effect?
Big Picture Again • Again, do we care about turnout? • What can we do to fix it?