Economic Freedom Impact: The Great Stagnation of American Household Income
Explore the impact of economic policies on the stagnant income of the American middle class since the mid-1970s. Analyze wage trends, household size changes, and the distribution of economic benefits. Evaluate Milton Friedman's policies and challenges in measuring living standards.

Economic Freedom Impact: The Great Stagnation of American Household Income
E N D
Presentation Transcript
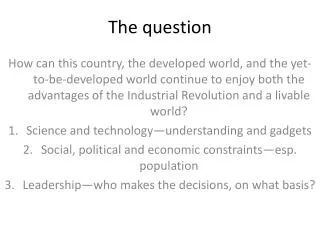
The Question Has ‘more economic freedom’helped Americanssince the mid-1970s? Or, asked only somewhat differently…
inflation-adjusted, before-tax, money income for the median American householdhas stagnated since the mid-70s. (Today only about 18% higher.) • Inflation-adjusted hourly money wages for the median, non-supervisory workerhas hardly budged.
In 2012 dollars, average hourly earnings for non-supervisory workers in 1975 were $4.73. In 2012 dollars that’s $19.70. Today, they’re $20.42 – higher by a mere 3.6 percent
Great Stagnation? “Median [family] income is the single best measure of how much we are producing new ideas that benefit most of the American population. Yet the picture is depressing.” - Tyler Cowen, The Great Stagnation (2011) p. 14
Almost all the benefits of economic growth since [the 1970s] have gone to a small number of people at the very top. —Robert Reich, Financial Times, Jan. 29, 2008
So is this narrative correct? Are the policies advocated by Milton Friedman really a menace to the middle-class?
We could talk about how only a few of Friedman’s policy suggestions have been put in place….
… or we could talk about how measures of inflation inadequately account for changes in product quality….
… or we could talk about how, since the mid-1970s, the per-person size of the median household has fallen by 11 percent… … or about how much more compensation today is paid in the form of non-wage – or, “fringe” – benefits… … or about how what happens to a statistical measure, such as an ‘average’ or a ‘median,’ does not necessarily tell us what happens to the individuals whose actions make up the data.
Average Household Size: Down 24% in 50 Years 1960 3.4 persons 1970 3.2 1976 2.86 1980 2.8 1990 2.7 2000 2.7 2006 2.56 2010 2.57
Per-Household-Person Income In 1976 the average household was 2.86 persons, then it fell 10.5 percent by 2006 (to 2.56 persons). Per-household-person income, therefore, rose not by18% but by 32%.
But let’s not. Let’s look at living standard from another angle… Purchasing power.
2012 40 minutes
6.3 hours
4.4 hours (So, 11.4 hours total)
5.5 hours And it’s got wheels!
12.6 hours
30 minutes
57 hrs.
52 hrs.
73.4 hours
40.2 hours
13.1 hours
93 hours