The question
G41A-0887. Comparison of GRACE gravity field solutions, hydrological models and time series of superconducting gravimeters in Central Europe. de Viron O. 1 , Van Camp M. 1,2 , Métivier L. 3 , Meurers B. 4 , Francis O. 5.

The question
E N D
Presentation Transcript
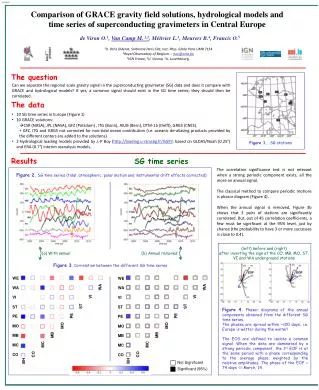
G41A-0887 Comparison of GRACE gravity field solutions, hydrological models and time series of superconducting gravimeters in Central Europe de Viron O.1, Van Camp M. 1,2, Métivier L.3, Meurers B.4, Francis O.5 1U. Paris Diderot, Sorbonne Paris Cité, Inst. Phys. Globe Paris UMR 7154 2Royal Observatory of Belgium -- mvc@oma.be 3IGN France, 4U. Vienna, 5U. Luxembourg. The question Can we separate the regional scale gravity signal in the superconducting gravimeter (SG) data and does it compare with GRACE and hydrological models?If yes, a common signal should exist in the SG time series; they should then be correlated. The data • 10 SG time series in Europe (Figure 1) • 10 GRACE solutions: • CSR (NASA), JPL (NASA), GFZ (Potsdam) , ITG (Bonn), AIUB (Bern), DTM-1b (Delft), GRGS (CNES). • + GFZ, ITG and GRGS not corrected for non-tidal ocean contribution (i.e. oceanic de-aliasing products provided by the different centers are added to the solutions) • 2 Hydrological loading models provided by J.-P Boy (http://loading.u-strasbg.fr/GGP/) based on GLDAS/Noah (0.25°) and ERA (0.7°) interim reanalysis models. Figure 1. SG stations SG time series Results The correlation significance test is not relevant when a strong periodic component exists, all the more an annual signal. The classical method to compare periodic motions is phasor diagram (Figure 4). When the annual signal is removed, Figure 3b shows that 3 pairs of stations are significantly correlated. But, out of 45 correlation coefficients, a few must be significant at the 95% level, just by chance (the probability to have 3 or more successes is close to 0.4). Figure 2. SG time series (tidal, atmospheric, polar motion and instrumental drift effects corrected) (left) before and (right) after inverting the sign at the CO, MB, MO, ST, VI and WA underground stations (a) With annual (b) Annual removed Figure 3. Correlation between the different SG time series WE WE WA WA WA WA VI VI VI VI ST ST Figure 4.Phasor diagrams of the annual components obtained from the different SG time series. The phases are spread within ~100 days; i.e. Europe is wetter during the winter! The EOS are defined to isolate a common signal. When the data are dominated by a strong periodic component, the 1st EOF is at the same period with a phase corresponding to the average phase, weighted by the relative amplitudes. The phase of the EOF = 74 days March, 14. ST ST PE PE PE PE MO MO MO MO MB MB MB MB MC MC MC MC CO CO BH CO CO Not Significant BH Significant (95%)
SGs vs GRACE & Hydrologicalmodels The sign of the SG data from the CO, MB, MO, ST, VI and WA underground stations is inverted • Figure 5.Phasor diagrams of the annual components at different SG stations for • the 10 different GRACE solutions; • the GLDAS and ERA hydrological models. • For clarity, the amplitude of the hydrological models is reduced by a factor 2. • The phases of the GRACE solutions are within 66 days at all SG sites (42 days without BH, MB, WA & ST closer to the Atlantic ocean, where GRGS and ITG phases show resp. further away and closer from January 1st, see also Figure 6). • The amplitudes of the hydrological models (esp. GLDAS) are much larger than that of SG or GRACE series. • Possible causes: topography & building umbrella effects (SG), local hydrogeology (SG), smoothing effect (GRACE). • It is difficult to accept from those results that the seasonal signal seen by the SGs is the same as the ones form the GRACE and hydrological models. Figure 6. Phase dispersion of the annual components in the GRACE solutions, the hydrological models, the SG time series. Available as an e-Poster Discussion There is no significant common annual signal between the different SGs, There is no significant common annual signal between the SGs and the predictions based on the GLDAS/NOAH and ERA hydrological models, There is no significant common annual signal between the SGs and the 10 GRACE solutions. After correcting for the annual signal, there is no more significant correlation between the different SG time series. Recent studies evidenced that most of the gravity effects recorded by SGs are induced by subsurface water dynamics in a radius around the gravimeter smaller than 1000 m; and some authors claim that the local effects, which may mask the large scale ones, must be corrected prior comparison with GRACE. But, even if there is a dominant common signal in the SGs and if local hydrogeological models are perfect, most of the common signal will be removed together with the local effects, and the residuals will be difficult to interpret in terms of large scale load distribution. Terrestrial gravity measurements can be fruitfully used to perform comprehensive, local hydrogeological investigations, as shown in Wettzell using an SG (Creutzfeldtet al., WRR 2010) or in the Larzackarstic area (Jacob et al., 2010); on the other hand GRACE has provided numerous information on large scale hydrological and geodynamic phenomena. But, this study shows that the relevance of their intercomparison is still to be demonstrated. Acknowledgements The authors thank the operators of the SG stations. The data from MO, PE and ST were obtained through the GGP project database hosted by the GFZ Potsdam. We are grateful to J.-P. Boy for fruitful discussions and making available the atmospheric and hydrological loading models. We thank L. Vandercoilden for her assistance in the processing of the GGP data, and to H. Wziontek for comments and processing the BH, MC & WE SG time series.