Download
1 / 39
400 likes | 624 Vues
A National Ecosystem Services Classification System (NESCS) – NESCS as a Nexus for Ecosystem Services Research, Policy, Effects, and Valuation. NESCS Workshop II: Progress and Prospects U.S . EPA 17 September 2013. Charles Rhodes ORISE Post-Doctoral Fellow

E N D
A National Ecosystem Services Classification System (NESCS) – NESCS as a Nexus for Ecosystem Services Research, Policy, Effects, and Valuation NESCS Workshop II: Progress and Prospects U.S. EPA 17 September 2013 Charles Rhodes ORISE Post-Doctoral Fellow U.S. Environmental Protection Agency Office of Water – Water Policy Staff, Office of Research and Development – Western Ecology Division rhodes.charlesr@epa.gov
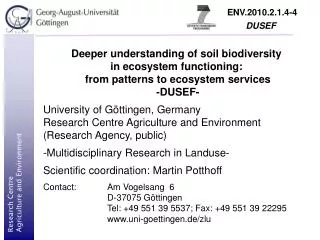
What is the relation between the industrial society upon which we depend and the ecosystems which we depend on for resources? • Can human activity upset or harm ecosystem dynamics from which we draw? • Is there waste, pollution, or environmental destruction? • What is the scale of these relative to natural cycles of generation and regeneration? • Is the scale changing over time, and if so, in what manner? pre-industrial, industrial, post-industrial
http://upload.wikimedia.org/wikipedia/commons/a/a7/Cuyahogarivermap.pnghttp://upload.wikimedia.org/wikipedia/commons/a/a7/Cuyahogarivermap.png
June 23, 1969: same river in Northeast Ohio, new fire. “…the last of a dozen fires over 100 years of industrial development.” Michael Scott, The Cleveland Plain Dealer, January 4, 2009 “Many people see this fire as being a catalyst for the federal Clean Water Act and other environmental laws.” Jane Goodman, South Euclid, OH councilwoman, 2009 Ohio EPA biologist(s) fish count, mid-1980s: 10 In 2009, 40 years after the last Cuyahoga River fire: 40 species of fish • Identify man’s impact (the problem) • Make economic and institutional changes to stop causing the problem • let nature recover, and ecosystem servicesstart flowing again But point-source is easy. Small-scale relative to non-point source. Picture is of some of damage from 1969 fire, and a fire crew. http://blog.cleveland.com/metro/2009/01/after_the_flames_the_story_beh.html
Ecosystem services are harder to account for: harder to define, harder to measure, harder to abate. So while appealing in theory, it is harder to get traction for ecosystem services in concrete policy debates. • Efficient rational decision making values, in order: • facts • known probabilities • lesser-known possibilities • unknowns and conjecture
People who want to use natural resources as if they were endless may exploit the difference between what nature does, and how well we model and measure what nature does. NESCS seeks to correct this bias – to expand the accepted base for arguments that employ deeper awareness of how human action impacts environmental resources and processes.
What is the relation between the industrial society upon which we depend and the ecosystems which we depend on for resources? The scale The intensity Measuring the scale and intensity of human activities that affect the environment matters
How well-developed and standardized the definitions and measures of ecosystem services (ES) are, has a strong effect on what we bring to policy debates – as scientists, polluters, or regulators. If true population of ES is close to θ, and we are working with biased estimator θ- ε, the results are predictable: underestimationof ES value. θ - ε • Biased estimator – without the full range of ecosystem services: • fewer assigned benefits (or costs associated with loss of ES) • lower mean (average) • leptokurtic distribution (has narrower range of even biased estimates)
What is the relation between the industrial society upon which we depend and the ecosystems which we depend on for resources? Human measurement natural sciences Measure from physics up through physical and biological systems social sciences Measure things that follow from the human mind and human activities What to measure? How cross the “divide” between natural and social science approaches? Ecologists Economists Where do we define a measure to begin or end? How do we sort them? Need: Classification System
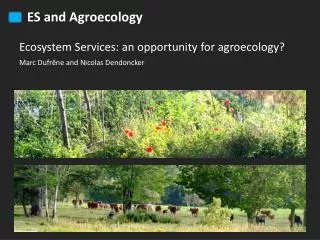
Economists build a theory that would bridge to values for Ecology Economists A Total Economic Value Framework Ecology • Needs: • a way to isolate non-marketed (un-priced) elements that humans “value” • a way to measure human “value” on these elements • best if also know the processes that generate or affect non-market elements and how humans place value on them
Ecologists • Ecology and related fields • Study systems and processes whose time and scope can dwarf human direct experience • Naturally difficult to model; difficult to see what to measure, where to focus, where “value” might be (unlike basic economic theory) As with economics beyond the price system, ecologists who care about what humans value are faced with difficulty of what to measure. Another blind spot?
Ecologists build a theory that would bridge to values for Economists Ecologists Economy Ecologists develop ecosystem services (ES) concept: humans rely upon and derive value from processes, products, and services for which there are very rarely prices or even direct measures. Ehrlich, Ehrlich, Holden (1977); Daily (ed.)1997 What are ecosystem services, and how do we measure them in a “meaningful” way? ES need to be classified, but by whom and to what purpose? Can the classification be standardized so that the needs of different academic fields may be accommodated?
Growing ES literature since Daily (1997), as ecologists, researchers, and policy makers try to apply ES concept: • De Groot et al (2002); MEA (2005); Boyd and Banzhaf (2007); • Wallace (2007); Fisher and Turner (2009); Staub et al (2011); • Haines-Young and Potschin (2012); Others Millennium Ecosystem Assessment (MEA) 2005: Supporting Services: soil formation, nutrient cycling, primary production Provisioning Services: fresh water, food, fiber, genetic resources Regulating Services: water purification, climate and disease regulation Cultural Services: spiritual, recreation & tourism, educational, heritage • Double Counting: • freshwater as provisioning and as water regulation and as purification? • most“regulating” services may prove intermediate, but counted again when “provisioning”
Ecologists Problems when attempting to quantify from MEA classification: 1) benefits ≠ services 2) not a set of clear, unique, unduplicated, measures MEA classification mixes “processes (means) for achieving services and the services themselves (ends) within the same classification strategy” Boyd and Banzhaf (2007) Impasse: much of field not moving toward measuring ES in a way policy makers can use Boyd and Banzhaf (2007) indicate a potential way forward: count only those ES that directly enter the human economy, at the point they do: Final Ecosystem Goods and Services (FEGS)
NESCS- General Approach • ClassifyTypes of FEGS, to map a pathway by which any ES can pass in any way from the ecosystem into the human value chain • Draw on methods used (by the Bureau of Economic Analysis (BEA), U.S. Census Bureau and other federal agencies) to classify goods and services exchanged in the market economy • NAICS: How are ECONOMIC goods and services produced/ Who produces (SUPPLY SIDE) • NAPCS: How are ECONOMIC goods and services used/ Who consumes (DEMAND SIDE)
NESCS – Objectives • Align EPA Office objectives and resources to build a common framework to bring relevant non-marketed ecosystem services (ES) more directly to bear in policy decision making • Aid in analyzing impacts of policy-induced marginal changes in ecosystems on human welfare: • support cost-benefit, cost-effectiveness, and distributional analyses • establish the logical structure for mapping how ecosystem changes affect human welfare, and develop a policy application • - further research (ORD) will make this structure more useful to policy makers (OW & OAR) using the application • Measure welfare changes due to a policy change. This entails: identifying, quantifying, and valuing changes in the contributions of ecosystems to human welfare
Three distinct steps needed to assign benefits from “ecosystem services” to discrete welfare changes: Identify/Classify/Discretely Sort 111001011000010110111110101000101110110111111000101011000010110100111101 Quantify Monetize Let’s mock through this, starting with a “nebulous” example:
Rainbow Fire Cloud – better known as a circumhorizon arc
Identify/Classify/Discretely Sort? Quantify? Value and/or Monetize?
Identify/Classify/Discretely Sort: Dark sky … Sky <50% color … Sky 50% < x <100% color … Spectral-color sky (<10% cloud) … Cloud-rainbow mix, w/silver lining … Cloud-rainbow mix, w/out silver lining … Dark cloud (<10% light) Quantify the Classified and Sorted: Dark sky = 17 Sky <50% color = 5 Sky 50% <x<100% color = 2 Full-color sky (<10% cloud) = 7 Cloud-rainbow mix, w/silver lining = 9 Cloud-rainbow mix, w/out silver lining = 1 Dark cloud (<10% light) = 19 Total = 60 Monetize: x $0.01 x $0.10 x $0.25 x $1.00 x $1.51 x $0.20 x $0.00 $21.96
Beauty, rich tide pool life, sea lion and bird breeding and sanctuary, heritage…
NESCS and Next Steps: • Set a New Standard for ES Classification • Map all relations between FEGS and human economy / human values • Unique pathways • No double counting • Bridge to existing classification systems: FEGS, NAICS/NAPCS • Build an App – Framework for a user-friendly policy tool • Scalable • Capable of marginal policy analysis • Capable of direct application to green accounting • Establish an Institutional Forum • A processing structure that iteratively identifies match-points between research and policy needs, and provides a vocabulary and a clearinghouse for communicating needs between EPA offices
Illustrative Policy Applications • Purpose: • Illustrate key unique features of NESCS design, which sets the frame for marginal policy analysis • Demonstrate steps for applying the NESCS framework and categories to identify pathways that potentially may be impacted by policy changes • Specific Policy Applications: • Air Quality Standards for nitrogen and sulfur oxides (NOx & SOx): • Quality change in end-product (air) • National Policy • Wetlands Restoration: • Quantity Change in stock of natural capital in an environmental class (wetland) • Regional policy Cross-Media, Different Scales
Our Classification Scheme NESCS-S to NESCS-D categorize FEGS “end products”, and decompose “beneficiaries” into “uses” and “users”
NESCS Conceptual Frameworkwith Fishing Example Economic Supply-side NAICS NAPCS Economic Demand-side Final Economic Production Commercial fishing; Processing of fish Physical Capital and Labor Fishing & processing equipment, Hours spent fishing & processing Intermediate Economic Production Commercial fishing Human Well-being Household Utility Function Human Systems capital and labor services Intermediate Economic Goods & Services Fresh fish sales to canneries Final Economic Goods & Services Fresh fish sales to households; Canned fish sales to households NESCS-D Flows of FEGS Fish stocks contributing to commercial fishing Fish stocks contributing to recreational fishing Flows of FEGS Flows of FEGS Fish stocks contributing to commercial fishing Natural Systems NESCS-S Natural Capital Streams & Lakes Ecological Production FEGS Stocks Fish Fish Health & Reproduction
Pathway Linking Policy Changes to Human Well-Being Policy Change Environmental Class (Intermediate) Ecological Processes End-Products Changes in Final ES Flows Changes in Direct Uses Direct Users Changes in Human Welfare
Representation of Multiple Mutually Exclusive Pathways Between Policy-Related Ecosystem Impacts (ΔN) and Changes in Human Well-Being (ΔW) ΔY1 ΔW1 ΔY2 ΔW2 ΔY3 ΔW3 • • • • ΔE1 • • ΔE2 ΔYm ΔWj Policy Action ΔN • ΔE3 • ΔE4 ΔWj+3 • • • • • • ΔEn ΔWj+p ΔN = Change in Natural Capital ΔE = Change in Ecological end products (types of FEGS) ΔY = Change in Final Economic Goods and Services ΔW = Change in human well-being (welfare)
Proposed 4-Group NESCS Structure Levels 3, 3a, 3b Levels 4, 4a Levels 1, 1a Levels 2, 2a
Applying NESCS for Policy Analysis: A Wetlands Restoration Program Example (Tracing Pathways for Different Wetland Functions)
“Make Table” Links Direct Uses to End Products Which ecosystems/end-products support which uses? “X” indicates potential ES
What is Missing without NESCS collaboration? • research and programs do not approach ES issues in an institutionally efficient way • each group faces limited money and time, so have a natural incentive to narrow their own effort • inadequate signaling of needs and coordination efforts between offices • old constraints remain new constraints • methods and databases are more likely to be built without coordination to make them useable for other objectives, other offices, or other agencies • With NESCS: • we will eventually want rules/dynamics for production of FEGS, will want models for how and why systems will be stressed to threshold levels • EPA Offices become more discretely aware of other Offices’ needs
Development and Deepening: Institutional Communication and Evolution ES Valuation Iterative Development of Methods and Metrics; Database Mergers Iterative Development of Policy Application Tool ES Quantification NESCS Classification
Application and Evolution: Institutional Communication and Evolution ES Valuation ES Quantification Iterative Development of Policy Application Tool Iterative Development of Methods and Metrics; Database Mergers NESCS
NESCS will work • Real-world examples: built • Logical barriers to full build out: none • - large, but tractable • Looking today for potential stakeholders, academics, and ecosystem service specialists to review, inquire, critique, and suggest
Thank you!! I will be available for questions throughout the day! Or contact me later: Charles R. Rhodes ORISE post-doctoral fellow rhodes.charlesr@epa.gov 202 564 9642
http://aflalbio.webs.com/apps/photos/photo?photoid=84962703 http://blog.cleveland.com/metro/2009/01/after_the_flames_the_story_beh.html http://www.weibull.com/DOEWeb/unbiased_and_biased_estimators.htm http://www.flickr.com/photos/paul-w-locke/300048279/sizes/l/in/photostream/ http://earthjustice.org/slideshows/campaigns/images-of-mountaintop-removal-mining#/sites/default/files/04-mtr-aerial-700.jpg http://i2.cdn.turner.com/cnn/dam/assets/120803054404-us-drought-tractor-story-top.jpg http://cdn.breitbart.com/mediaserver/Breitbart/Big-Journalism/2013/06/11/global_warming.jpg http://www.recognitionsource.com/images/thumbs/0000318.jpeg http://en.wikipedia.org/wiki/Biological_classification http://theecoadmirer.com/wp-content/uploads/2013/07/Pollution.jpg