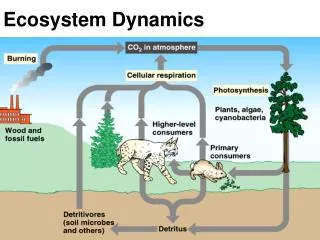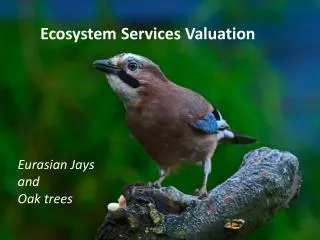
Ecosystem Services: Dynamics, Modeling and Valuation
Ecosystem Services: Dynamics, Modeling and Valuation. Finite Global Ecosystem. S. o. l. a. r. E. n. e. r. g. y. E. n. e. r. g. y. E. n. e. r. g. y. G. r. o. w. i. n. g. ". E. m. p. t. y. Source. Sink. E. c. o. n. o. m. i. c. Functions. Functions. S.

Ecosystem Services: Dynamics, Modeling and Valuation
E N D
Presentation Transcript
Finite Global Ecosystem S o l a r E n e r g y E n e r g y E n e r g y G r o w i n g " E m p t y Source Sink E c o n o m i c Functions Functions S u b s y s t e m R e s o u r c e s R e s o u r c e s W o r l d " R e c y c l e d M a t t e r W a s t e H e a t
”Empty World" Model of the Economy Individual Property rights Utility/welfare Private Public Consumption (based on fixed Manufactured Building preferences) capital Goods Cultural Norms and GNP Economic and Perfect Substitutability Education, Training, Labor Policy Research Process Services Between Factors Investment Improvement Land (decisions about, taxes government spending, education, science and technology policy, etc., based on existing property rights regimes)
FInite Global Ecosystem S o l a r E n e r g y E n e r g y E n e r g y G r o w i n g Source Sink " F u l l E c o n o m i c Functions Functions S u b s y s t e m W o r l d " R e s o u r c e s R e s o u r c e s Recycled Matter W a s t e H e a t
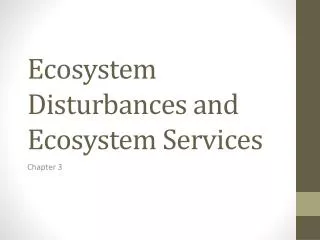
Degradation of ecosystem services often causes significant harm to human well-being • The total economic valueassociated with managing ecosystems more sustainably is often higher than the value associated with conversion • Conversion may still occur because private economic benefits are often greater for the converted system
“Full World” Model of the Ecological Economic System positive impacts on human capital capacity being, doing, relating Well Being (Individual and having, being Ecological Community) Complex property services/ doing, relating rights regimes amenities - having, Individual Common Public having - being Consumption (based on changing, Solar adapting Wastes Energy preferences) Restoration, Natural Capital Conservation Economic Evolving Goods Education, training, Human Capital Cultural GNP and Between Capital Forms Production Norms and research. Limited Substitutability Policy Services Institutional Process SocialCapital rules, norms, etc. Investment (decisions about, taxes Manufactured Building community spending, Capital education, science and technology policy, etc., based negative impacts on all forms of capital on complex property rights regimes) Materially closed earth system Waste heat From: Costanza, R., J. C. Cumberland, H. E. Daly, R. Goodland, and R. Norgaard. 1997. An Introduction to Ecological Economics. St. Lucie Press, Boca Raton, 275 pp.
Quality of Life (QOL) as the interaction of human needs and the subjective perception of their fulfillment, as mediated by the opportunities available to meet the needs. From: Costanza, R., B. Fisher, S. Ali, C. Beer, L. Bond, R. Boumans, N. L. Danigelis, J. Dickinson, C. Elliott, J. Farley, D. E. Gayer, L. MacDonald Glenn, T. Hudspeth, D. Mahoney, L. McCahill, B. McIntosh, B. Reed, S. A. T. Rizvi, D. M. Rizzo, T. Simpatico, and R. Snapp. 2006. Quality of Life: An Approach Integrating Opportunities, Human Needs, and Subjective Well-Being. Ecological Economics (in press).
NATURE |VOL 387 | 15 MAY 1997 253 article The value of the world’s ecosystem services and natural capital Robert Costanza*†, Ralph d’Arge‡, Rudolf de Groot§, Stephen Farberk, Monica Grasso†, Bruce Hannon¶, Karin Limburg#I, Shahid Naeem**, Robert V. O’Neill††, Jose Paruelo‡‡, Robert G. Raskin§§, Paul Suttonkk & Marjan van den Belt¶¶ * Center for Environmental and Estuarine Studies, Zoology Department, and † Insitute for Ecological Economics, University of Maryland, Box 38, Solomons, Maryland 20688, USA ‡ Economics Department (emeritus), University of Wyoming, Laramie, Wyoming 82070, USA § Center for Environment and Climate Studies, Wageningen Agricultural University, PO Box 9101, 6700 HB Wageninengen, The Netherlands kGraduate School of Public and International Affairs, University of Pittsburgh, Pittsburgh, Pennsylvania 15260, USA ¶ Geography Department and NCSA, University of Illinois, Urbana, Illinois 61801, USA # Institute of Ecosystem Studies, Millbrook, New York, USA ** Department of Ecology, Evolution and Behavior, University of Minnesota, St Paul, Minnesota 55108, USA †† Environmental Sciences Division, Oak Ridge National Laboratory, Oak Ridge, Tennessee 37831, USA ‡‡ Department of Ecology, Faculty of Agronomy, University of Buenos Aires, Av. San Martin 4453, 1417 Buenos Aires, Argentina §§ Jet Propulsion Laboratory, Pasadena, California 91109, USA kkNational Center for Geographic Information and Analysis, Department of Geography, University of California at Santa Barbara, Santa Barbara, California 93106, USA ¶¶ Ecological Economics Research and Applications Inc., PO Box 1589, Solomons, Maryland 20688, USA . . . . . . . . . . . . . . . . . . . . . . . . . . . . . . . . . . . . . . . . . . . . . . . . . . . . . . . . . . . . . . . . . . . . . . . . . . . . . . . . . . . . . . . . . . . . . . . . . . . . . . . . . . . . . . . . . . . . . . . . . . . . . . . . . . . . . . . . . . . . . . . . . . . . . . . . . . . . . . . . . . . . . . . . . . . . . . . . . . . . . . . . . . . . . . . . . . . . . . . . . . . . . . . . . . . . . . . . . . . . . . . . . . . . . . . . . . . . . . . . . . . . . . . . The services of ecological systems and the natural capital stocksthat produce them are critical to the functioning of the Earth’s life-support system. They contribute to human welfare, both directly and indirectly, and therefore represent part of the total economic value of the planet.We have estimated the current economic value of 17 ecosystem services for 16 biomes, based on published studies and a few original calculations. For the entire biosphere, the value (most of which is outside the market) is estimated to be in the range of US$16–54 trillion (1012) per year, with an average of US$33trillion per year. Because of the nature of the uncertainties, thismust be considered a minimum estimate. Global gross national product total is around US$18 trillion per year. This is the 2nd most cited article in the last 10 years in the Ecology/Environment area according to the ISI Web of Science.
Focus: Consequences of Ecosystem Change for Human Well-being
GUMBO (Global Unified Model of the BiOsphere) From: Boumans, R., R. Costanza, J. Farley, M. A. Wilson, R. Portela, J. Rotmans, F. Villa, and M. Grasso. 2002. Modeling the Dynamics of the Integrated Earth System and the Value of Global Ecosystem Services Using the GUMBO Model. Ecological Economics 41: 529-560
Amoeba diagram of complexity with which Integrated Global Models (IGMs) capture socioeconomic systems, natural systems, and feedbacks (from Costanza, R., R. Leemans, R. Boumans, and E. Gaddis. 2006. Integrated global models. Dahlem Workshop on Integrated History and future of People on Earth (IHOPE). (in press)
Ecosystem functions: The capacity of natural processes and components to provide goods and services that satisfy human needs. (de Groot, 1992)Ecosystem Services: Valued Ecosystem Functions. R.S. de Groot et al. / Ecological Economics 41 (2002) 393–408
Werners, S.E. and R. Boumans (2005) Simulating global feedbacks between Sea Level Rise, Water for Agriculture and the complex Socio-economic Development of the IPCC Scenarios, In: Proceedings Environmental Modelling and Software Society Conference: Complexity and Integrated Resources Management (IEMSS2004), Osnabrück, June 2004
6 5 500 Welfare per GWP 4 3 20 2 400 -2 10 6 5 15 300 trill. US Dollars (1998) 4 3 welfare Index per trill. 1998 US dollars 2 billion people 200 -3 10 10 6 5 4 100 3 2 5 -4 10 1900 1950 2000 2050 Year 1900 1950 2000 2050 1900 1950 2000 2050 Year EcosystemServices Value Human Population Observations Scenarios Base Case Star Trek (ST) Big Government (BG) Mad Max (MM) Eco-Topia (ET)
Conventional economic valuation presumes that people have well-formed preferences and enough information about trade-offs that they can adequately judge their “willingness-to-pay.” These assumptions do not hold for many ecosystem services. Therefore we must:
(1) inform people’s preferences as demonstrated by DeGroot et al. Costanza et al.; • (2) allow groups to discuss the issues and “construct” their preferences in development under ARIES, TNC InVest and the ESR (Corporate Ecosystem Services Review, developed by the World Resource Institute or • (3) use other techniques that do not rely on preferences to estimate the contribution to human welfare of ecosystem services (i.e. using the models developed to directly infer marginal contributions to welfare). The MIMES approach.
Ecological Economics 41 (2002) 393–408 SPECIAL ISSUE: A typology for the classification, description and valuation of ecosystem functions, goods and services Rudolf S. de Groot, Matthew A. Wilson, Roelof M.J. Boumans
Existing & Emerging Tools • ARIES (Assessment and Research Infrastructure for Ecosystem Services), which is under development by the University of Vermont’s Ecoinformatics Collaboratory (within the Gund Institute for Ecological Economics), Conservation International, Earth Economics, as well as with collaboration from experts at Wageningen University. An initial online version will be launched in 2008. • ESR (Corporate Ecosystem Services Review), which was launched in March 2008 by the World Resources Institute (WRI), the Meridian Institute, and the World Business Council on Sustainable Development (WBCSD). • InVEST (Integrated Valuation of Ecosystem Services and Tradeoffs), which is in development by The Natural Capital Project—a joint venture among Stanford University’s Woods Institute for the Environment, The Nature Conservancy, and World Wildlife Fund—with the goal of issuing a manual in the Summer / Fall 2008 and software in Fall / Winter 2008. • MIMES (Multiscale Integrated Models of Ecosystem Services), which is currently available in an early version (“beta plus”) from the University of Vermont’s Gund Institute for Ecological Economics.
Info on the Benefit transfer Method • http://www.ecosystemvaluation.org/
1 Not every forest provides ecosystem services at the same rate2 Ecosystem service values are specific in time and space • Problems with the Benefits Transfer Method
Ecosystem Services classified according to spatial characteristicsOmni-directional, Global (does not depend on proximity) Carbon sequestration (NPP) Carbon storage Existence of “nature”Omni-directional, Local (depends on proximity) Storm protection Waste treatment PollinationDirectional flow related: flow from point of production to point of use Water supply Water regulation/flood protection Nutrient regulation Sediment regulation In situ (point of use) Rangeland for livestock Nitrogen mineralization for ag. production Soil formation Raw materials Non-timber forest productsUser movement flow related: flow of people to unique natural features Aesthetic/recreation potential
Dynamic Modeling and Mapping Tool Innovative, online dynamic modeling and mapping tools for ecosystem services analysis at multiple scales (2013)
MIMES Objectives / Goals • Develop a sophisticated and transferable system to elucidate dynamics of ecosystem services. • Develop a dynamic spatial model • Collect data • Provide a user interface • Understand the link between ecosystem services and human welfare • Develop valuation protocols • Forecast changes in ecosystem functions and values under various management scenarios. • Model scenario development
Outcome 1. a suite of dynamic ecological economic computer models specifically aimed at integrating our understanding of ecosystem functioning, ecosystem services, and human well-being across a range of spatial scales • Outcome 2. developed and applied new valuation techniques adapted to the public goods nature of most ecosystem services and integrated with the modeling work.
MIMES organization and Interaction Matrix Social Capital Human Capital Economie Locations Biosphere Anthroposphere Ecosystem Services Cultures Earth Surfaces Nutrient Cycling Biodiversity Exchanges Between Locations Hydrosphere Lithosphere Atmosphere Geological Carbon Earth Energy Water by Reservoir Gasses Ores
Spatially explicit functional modeling Government Investments Economics Sectors Final demand
Economic Sectors Government Investments Fossil Energy Research Invested Capital Production Efficiency Ecosystem Services Tax Production Inventories Price Final demands Sector dependencies
Oceans Ecosystems (% Area) Croplands Wetlands Urban Tundra Forests
1990 economic production in $ PPP per country Research Households Agriculture Transportation Tourism Fisheries
Ecosystem Service (index) Cultural Heritage Climate Regulation Biological Regulation Genetic Information Natural Hazard Mitigation Inorganic Resources
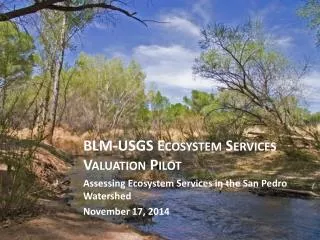
The Albemaro Pemleco Watershed Surface water output Ecosystem Services Provided
Location 12 Midwest States Biosphere Anthroposphere Earth Surfaces NLCD and CDL water, forest, wetland, amended cropland, urban Cultures Ecosystem Services ReVA economic vitality climate regulation water quality water quantity human health quality of life biodiversity recreation Social Capital Biodiversity Nutrient Cycling SWAT nitrogen sediment Atrazine carbon phosphorus Human Capital Economy FAPRI Hydrosphere Atmosphere Lithosphere surface water SWAT Earth Energy Geological Carbon river channel Gasses MARKAL CMAQ groundwater Ores
US Wetlands Location Biosphere Anthroposphere Ecosystem Services Carbon sequestration Water quality/quantity Flood/storm protection Wildlife habitat Fisheries support Human well-being Earth Surfaces Cultures Social Capital NutrientCycling CENTURY C, N, P Biodiversity Waterfowl in MS Vector-borne disease Human Capital Economy Lithosphere Atmosphere Hydrosphere Geological Carbon Earth Energy Atm. forcing Water Cycling KINEROS2-OPUS2 SWAT Probabilistic storm surge Gasses Ores
Geological Carbon Ores Location Coastal Carolinas* Anthroposphere Ecosystem Services Biosphere Cultures Earth Surfaces • water cleansing • primary productivity • fish community composition • fish whole body conc. (Hg) • water quantity Social Capital Nutrient Cycling Biodiversity Human Capital BASS SWAT N,P, Hg, Pesticides Economy Habitat Suitability Atmosphere Hydrosphere Lithosphere Water by Reservoir Earth Energy WASP Gasses CMAQ H20, N, Hg GFLOW
Location Coral Reefs Biosphere Anthroposphere Ecosystem Services Shoreline protection Fishing Tourism Biodiversity Earth Surfaces Reef, algae, wetland, forest, urban, agriculture Cultures Social Capital LDI index Statistical models Human Capital Nutrient Cycling Nitrogen CaCO3 Biodiversity Economy Coastal protection index Statistical models WRI valuation methods SORTIE Atmosphere Lithosphere Hydrosphere Earth Energy Climate change SST, solar radiation Benthic substrate Open water Ocean circulation Storm frequency Geological Carbon Gases Climate change CO2 Groundwater Ores Surface water
Lithosphere Geological Carbon Ores Location Tampa Bay Biosphere Anthroposphere Ecosystem Services water supply water quality CO2 sequestration flood protection food and fiber production habitat and biodiversity recreation nitrogen regulation Earth Surfaces water, forest, wetlands, agriculture, urban Cultures Social Capital Nutrient Cycling C, N, P, Hg Biodiversity Human Capital Economy Hydrosphere Atmosphere Earth Energy Water by Reservoir Gasses O3
Location Willamette Basin Biosphere Anthroposphere Ecosystem Services Water Supply Flood Protection CO2 Sequestration Nitrogen Control Food and Fiber Habitat Biodiversity Sense of Place Earth Surfaces Forests, Wetlands Agriculture, Urban Cultures Social Capital Nutrient Cycling GT MEL Century SPARROW N, C, Hg Biodiversity PATCH Human Capital Economy Hydrosphere Lithosphere Atmosphere Geological Carbon Earth Energy Water GA Tech Model CLIGEN KINEROS MODFLOW Gasses Ores