Download
1 / 43
440 likes | 687 Vues
Valuation of ecosystem services Linking theory and practice. Anirban Ganguly TERI IGNFA, June 19, 2013 . Ecosystem services.

E N D
Valuation of ecosystem servicesLinking theory and practice AnirbanGanguly TERI IGNFA, June 19, 2013
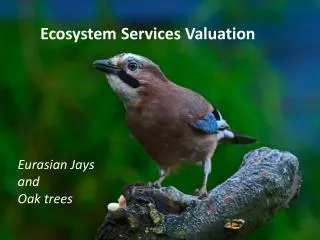
Ecosystem services Ecosystem services are those services that are enjoyed by human beings on account of the functioning of ecosystem processes, without the need of any capital-intensive transformation
Valuation of ecosystem services • Putting a label (a price tag) • Creating a basis for comparison • Creating a basis for exchange • Creating a rallying point (a basis for negotiation)
Looking through – what motivates valuation • Valuation as rhetoric • Valuation for scorekeeping (natural resource accounting) • Valuation for planning(say land use change decisions) • Valuation for impact assessment • Valuation for payment • Valuation as politics
Valuation as rhetoric Costanza (1997) estimates the value of 17 ecosystem services of the world at $ 16-54 trillion /yr. The average value of $ 33 trillion / yr is almost double that of the global GNP. Value of forests Tropical: $2007/ha/yr (Rs10000/ha/yr) Temperate/boreal:$302/ha/yr (Rs1500/ha/yr)
Valuation as rhetoric • Makes the potential value of ecosystems apparent • Makes a first approximation of the relative magnitude of ecosystem services • Sets up a framework for further research • Stimulates debate and advocacy
Valuation for accounting • Keeping track of the national economy • Forests (timber, fuelwood, NTFPs) contribute 1.2-1.8% of India’s GDP [Services: 57%, Industry: 26%, Agriculture/fishing/forestry: 17% (CSO estimates for 2008-09)] • Are the figures comparable • Are methods consistent • Keeping track of the global economy • Geniune savings • Ecological footprints
National Income Accounts (conventional) • Forestry (Gathering of forest products – major and minor) • Logging and transportation of forest products to depots • Farmyard wood (Industrial and fuelwood collected by primary producers from trees outside forests) Fuelwoodbased on household and industrial consumption, rather than on production The value added ignores consumption of natural capital.
National Income Accounting (Alternative/ green) • Depletion (Logging, including illegal) • Reductions (Forest fires, shifting cultivation etc) Haripriya (2001) estimates depletion value at 34% of her estimates of total value added. Deducting depletion value from the NDP gives the Environmentally Adjusted NDP (EDP)
Ecological footprint An estimate of the amount of biologically productive land and sea area to regenerate the resources a human population consumes and to absorb the corresponding waste, given prevailing technology
Ecological footprint Source: http://www.footprintnetwork.org/gfn_sub.php?content=global_footprint
Ecological footprint http://www.footprintnetwork.org/gfn_sub.php?content=maps_page
Valuation for planning • Providing a basis for land use change decisions • Providing a basis for sectoral allocations
Forest land diversion When forest land is diverted into a non-forest use, the new set of benefits can be either of private or public nature. Private: Industrial use, mining, SEZ Public: Defence, roads, schools, hospitals
The case of hydropower • Hydropower development is dependent on availability of water and a suitable gradient • Highest hydropotential is expectedly offered by the North-eastern states (31857 MW; 95% untapped) and the northern states (30155; 73% untapped)
Source: Indian National Hydropower Association (2005) 73.3% of 30155MW 72% of 5590 MW 43.5% of 10763 MW India’s (untapped) hydropower map 95.5% of 31857 MW
India’s forest map The N-E Region, with 8% of the country’s GA has 25% of FC.
Forests and poverty Overlap among areas of high forest cover, high poverty rate and high tribal concentration Source: Village Voices, Forest Choices Poffenberger and McGean (1996)
Forest vs poverty rate State level data (2009) shows a relatively weak correlation between % Forest cover and % BPL (Correlation Coefficient = 0.25)
Forests and Hydropower • Forests have a public good nature • India’s forest policy mandates 33% forest cover • Areas of high forest cover and high hydropotential co-exist • 44% of households do not have access to electricity (2001 census) • The National Electricity Policy (2005) aims to meet power demand fully by 2012 (Power for All) • Thermal power remains the main source of electricity (65% of total compared to 25% for hydro and 10% for nuclear and renewables) • The ‘desired’ thermal-hydro mix is at 60-40; in this sense, hydropower development is a priority
Diversion of forest land • An issue of converting one public good (forests) into another (electricity?) • Both associated with large externalities (1 Kwh of electricity consumption raises output by Rs 40, as per a 2007 TERI estimate) • An issue of mandatory payments by the project developer (user agency) • Compensatory afforestation • NPV • CAT • Mandatory R&R • 12% free power to home state • 1% free power for Local Area Development (2008 Hydro Policy)
The NPV issue • A payment of Rs 5.8 – Rs 9.2 lakh / ha in addition to the payments for Compensatory Afforestation as per FCA, 1980 • A payment for lost ecological services? • What constitutes forests – recorded forest area or forest cover • What is the basis for the amount, and is the range too narrow? • Distribution of the NPV amount • Does it cause a burden to hydro developers? • Which agencies deserve exemption?
CEC recommendations on NPV • 16 forest types grouped into 6 ecological classes • NPV recommended as per rates below (all figures in Rs ‘000/ha) Case no. WP (Civil) 202 of 1995, Judgement dated 28-3-08
The valuation challenge • Value the ecosystem services lost due to forest land conversion and the benefit stream created by the alternative land use using a consistent methodology • Valuation results could then provide a basis for informed debate and negotiations towards the land use change decision
Questions for valuation studies (An illustration) • Does the PFM programme generate significant non-labour benefit in the short run? • Does the PFM programme enhance equity at the intra and inter-village level?
Equity Income distributional weight (Wk) is defined as Wk = (Ỹ / Yk) ε where Ỹ = per capita income of comparator (H.P. in this case) Yk= per capita income of village k ε = Income aversion parameter
The notional recognition • NPV (Net Present Value) (again!) : The payments for the diversion of forest land for non-forestry purposes include the values of ecosystem services. • The recommendations of the 13th Finance Commission link centre-state fiscal transfers with the states’ forest cover and quality of the forest.
Classic cases of intra-region transfers • New York drinking water supply • Buyer: NYC • Seller: Upstream forest users • Vittelmineral water bottling, France • Buyer: Vittel • Seller: Upstream farmers
Valuation in the REDD+ context • Carbon a co-benefit; not the key benefit (India’s position) • Non carbon benefits such as biodiversity and hydrological benefits need to clearly identified and valued (at the relevant scale) as part of REDD preparedness • Benefit-sharing mechanisms to be worked out based on the ‘spread’ of values
Valuation as politics • The issue of intra-state transfers • Defining the boundary of externalities • Defining the recipients • The issue of land-use change • Defining the boundary of externalities • Defining the national interest • Dealing with the private interest • The issue of impact assessment • Defining the stakeholders • Defining the equity weights • The issue of international transfers • Understanding/ assessing the dominant services • Distinguishing local and global benefits
Concluding thoughts • Valuation is best seen as a public policy tool • Valuation could have several competing motivations – the results are not ‘motivation-neutral’ • Valuation can be a basis for informed politics (much like the anti-corruption movement) • Valuation can even be a tool for social levelling (numbers can be added/subtracted – but not words/thoughts/ideas – or can they?)
Concern for man and his fate must always form the chief interest of all technical endeavors. Never forget this in the midst of your diagrams and equations. Albert Einstein