Download
1 / 40
400 likes | 570 Vues
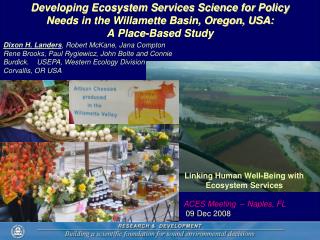
Dixon H. Landers , Robert McKane, Jana Compton Rene Brooks, Paul Rygiewicz, John Bolte and Connie Burdick. USEPA, Western Ecology Division Corvallis, OR USA. Developing Ecosystem Services Science for Policy Needs in the Willamette Basin, Oregon, USA: A Place-Based Study.

E N D
Dixon H. Landers, Robert McKane, Jana Compton Rene Brooks, Paul Rygiewicz, John Bolte and Connie Burdick. USEPA, Western Ecology Division Corvallis, OR USA Developing Ecosystem Services Science for Policy Needs in the Willamette Basin, Oregon, USA:A Place-Based Study Linking Human Well-Being with Ecosystem Services ACES Meeting – Naples, FL 09 Dec 2008
The EPA Challenge: Change the economic and human well-being foundation for environmental decision-making Current Investment: 200 Scientists ~$62 million dollars supporting research
Ecological Services Research Program Goals: • Long-Term Goal 1: National policy makers will have the tools and technologies to develop scientifically-defensible assessments of the state of our nation’s ecosystems and the effectiveness of existing national programs and policies • Long-Term Goal2: States and tribes apply improved tools and methods to protect and restore their valued ecological resources • Long-Term Goal 3: Decision-makers understand the importance of ecosystem services and make informed, proactive management decisions that consider a range of alternative outcomes
Uses • Setting policies and guidelines: • EPA often seeks to promote its mission through a variety of policy instruments that do not have the legal force of national rules. . • Quantifying benefits for national rule-making: • The Office of Management and Budget establishes data requirements needed to assess the benefits and costs associated with these rules. • Developing environmental GDP accounts or other environmental indicators: • In recent years, there have been numerous calls for establishing environmental accounts within our national Gross Domestic Product accounts. • Acting as a catalyst for market innovations: • In some cases, EPA seeks to engage the private sector directly in its efforts to improve environmental conditions.
EPA Ecological Services Research Program - Place-Based Studies Southwest
Why Place-Based Research? • Work with actual, interested end-point users of research tools to assist with design and implementation • Confront contextual social and economic forces, challenges and solutions • Test models with appropriate data types and coverages • Develop a manageable approach to scaling • Enlist “local” experts with knowledge tailored to the question and issues • Compare like and contrast different approaches to similar issues among PBPs • Synthesize knowledge derived from the above activities to determine what level of information is ADEQUATE for decision makers to project ES at a national scale.
65% Forest 20% Ag; 11% Urban 4% Riparian Wetland Not all forests are equal High elevation (N sensitive or N retentive?) Broadleaf vs. Conifer Willamette Ecosystem Service District Portland, OR Landcover
CLIMATE OF OPPORTUNITY Why the Willamette? • Willamette “Ecosystem Service District” provides a broad range of Land-Use/Land-Cover, stressors, gradients, and diverse, linked settings • WED Alternative Futures research experience (mid 1990’s) = rich data sets, experienced researchers, potential collaborators (NRCS, USACE, USDA-FS, USGS, OWOW, etc.) • Well Connected Research and Regulatory Entities now Working toward future Ecosystem Service trading (Region X) • Multiple related Star Grant recipients (OSU, OU, PSU) • Willamette Partnership (State Non-Profit); OWEB • Trading Scenario for Temperature (riparian wetland ecosystem service) rapidly developing – EPA Funding with Region X oversight • ORD Multi-Year Plan – Ecosystem Research Program: provides explicit context
Overall Goal:The W-ESP seeks to provide a scientifically based decision support system for valuing and projecting ecological services resulting from alternative management decisions Objectives:Quantify ecosystem services, including their distribution and status. Provide models to predict responses of ecosystem services to probable future conditions.Identify critical knowledge gaps in our understanding of how ecosystem services are provided.Evaluate net benefits of bundled ecosystem services and tradeoffs among management actions that affect these services.
Systems Thinking Avoiding Unintended Consequences
Decisions Policy, Regulatory, Economic, Political… Δ Stressors / Drivers Terrestrial Ecosystem Aquatic Ecosystem Δ Ecosystem (Quantitative ERFs)* FUNCTION Carbon, Nutrient & Water Cycling; Soil Formation & Degradation, Competition, Reproduction, Mortality, etc STRUCTURE Species, Food Webs, Spatial Organization, Soils STRUCTURE Species, Food Webs, Spatial Organization, Benthic & Water Column FUNCTION Carbon, Nutrient & Water Cycling; Sediment Dynamics, Groundwater Interactions Competition, Reproduction, Mortality, etc Adaptive Management Δ Ecosystem Services (Quantitative EPFs)** Δ Value (of ES Bundle)*** Stakeholder Prioritization Non-Economic Value $ $ $ $ $ Δ Human Well-being*** Willamette Conceptual Model: ALL LAND USES Forest Land Use Agricultural Land Use Riparian Land Use Water Quality & Quantity GCC Mitigation Fish & Wildlife Energy & Minerals Recreation & Tourism Wilderness Environmental Stressors / Drivers Anthropogenic Stressors / Drivers Climate Soils & Hydro- geomorphology Global Change Fire Land Use Hunting & Fishing Pests & invasives Chemicals Land, Air, Water Other Extractive Water Use Land Cover Fire Regulation Ag & Forest Products Carbon Sequestration GHG Regulation Water Quantity Water Quality Fish & Wildlife Extractive Energy, Minerals, Rx Sediment Regulation Biodiversity Recreation Air Quality Sense of Place
Inventory of Current Ecosystem Services: Approach and Knowledge Gaps • Identify key ecosystem services (ES) Willamette Ecosystem Services District • Determine appropriate units for ES • Develop an approach to inventory, “scale” and map ES • Identify knowledge gaps in assessing ES
Terrestrial Services • Ag products • Forest products • C sequestration • Nutrient regulation • GHG regulation • Habitat quality • Wildlife populations Aquatic Services • Water quality • Water quantity • Fish & waterfowl Cross Place Based Coordination on ES Willamette ESRP-Wide “Common” Services • Stressors • Land Use • Forest • Agriculture • Riparian • Urban • Global Change • Climate • CO2 • N deposition • Chemicals • Fertilizers • Pesticides Productivity Models Wildlife Populations Plant Communities Biogeochemistry Hydrology Carbon Storage Sense of Place Nutrient Cycling Stressors Effects ?? Social Scientist ?? Water Quality Water Quantity Biodiversity
Definition of Terms Used to Determine Future Responses of Ecosystem Services toMultiple Response Variables • Forcing Variables (Stressors) • Natural and anthropogenic factors affecting quantifiable changes in the status (e.g. amounts & fluxes) of ecosystem processes • ERF: Ecological Response Function • The response of an ecosystem service to a particular forcing variable • ETF: Ecological Trade-off Function • The relationships between two (or more) ecosystem services in response to the same forcing variable (…and, eventually, multiple forcing variables)
Conceptual Framework Ecosystem Service vs. Forcing Variable = ERF ERF1 ERF2 Crop Yield N Export N Fertilization N Fertilization • ERF Y-axis: Ecosystem Services • Food/fiber Yield • Carbon Sequestration • Water Quality • Water Quantity • GHG regulation (N2O, NOx, CH4 …) • ERF X-axis: Forcing Variables • Soils & Geology • Climate (Temp, Precip, Light, CO2) • Fertilization Practices • Tillage Practices • Cover Type (Species, Riparian Buffers…) • Many others… ERF1 + ERF2 Tradeoff = ETF Yield Crop Yield N Export N Export N Fertilization Socioeconomics Valuation & Trading of Ecosystem Services
Some Agricultural ERFs & ETFs • Read vertically to compare responses (ERFs) for a given service to 3 different stressors • Read horizontally to assess trade-offs (ETFs) among 3 services at any given stressor level Carbon Sequestration Water Quality Food Production Stream Nitrate Soil Carbon Crop Yield N Fertilization N Fertilization N Fertilization Soil Carbon Crop Yield Stream Nitrate Tillage Tillage Tillage Climate Crop Yield Soil Carbon Fertilization Tillage Stream Nitrate Drought Index Drought Index Drought Index
Scaling Up Ecosystem Services – Using Biophyical Models snobear.colorado.edu/IntroHydro/hydro.gif Basin, Region Plots, Stands Hillslopes, Catchments Using nitrogen addition & export as an example… Hillslope-Scale ERFs Basin-Scale ERFs Plot-Scale ERFs Less Buffers Low % sand Deep flowpaths ? N Export N Export Crop Yield ? ? High % sand More Buffers Shallow flowpaths N Fertilization Ag:Forest Area Ratio Buffer Width Models: Statistical and Process-Based Synthesize & Scale Up Data Plots to Region, Days to Centuries
Issues of Scale Unknown 1. Spatial Extrapolation Known 2. Decision Making and the Adequacy of Scientific Understanding e.g. Region to Tax Lot
Develop an approach to inventory and map ES Inventory and mapping the location and value of Ecosystem Services is an essential activity of W-ESP W-ESP (Chan et al. 2006)
Decision Support System – General Structure Clients: making multiple decisions by selecting policies responsive to their objectives Quantification and Valuation of Ecosystem Services: apply indicators reflecting quantity Landscape Feedback Actions Landscape: Spatial domain in which land use changes and other stressors are depicted Policy Selection Natural Change Processes: Models of non-human change Policies: Constraints and actions defining land use management decisionmaking Modified from John Bolte, Oregon State University
Native Grassland Headwater Wetland Riparian forest Vegetated buffer Rip Rap slope Row crop Grass seed Forest Urban + Relative value* 0 Ecosystem Services Nutrient removal Temperature regulation Carbon Sequestration - Habitat Flood protection Food & Goods Hypothetical ecosystem service values: Bundled by land use in the Willamette ESD *Relative value could be a rate, say kg/ha/yr, or represent economic or social value.
Limitations Regarding Implementation Disciplinary Needs: Sociologist – Human Health and Well Being; Mediated Modeling Economist – Market and Non-Market Valuation Modelers – System Approaches and Scaling
End Product Options Relative Ecosystem Services Within an Ecosystem District A B Forest C Row crop Livestock SAV Scaling and Aggregation Under Alternative Management Scenarios Mangrove Wetland Net Value of Services Headwater wetland Rip Rap slope Vegetated buffer strip Management Option X Urban
Desired Outcomes: Forcing Variables: Place-Based Societal Issues & Values • Predicted climate change • Air pollution • Land use management • Population growth • Clean rivers • Fish & Wildlife • Flood control • Timber& Crops • Wetlands Research Targeted to Develop Ecological Response Functions (ERF) and Ecological Trade-off Functions (ETF) Mapped Ecosystem Services Future Projections Ecosystem Structure & Functioning C-Sequestration Natural & Anthro- pogenic Stressors Past, Present & Future N-control Critical habitat Projected and Quantified Bundles of Ecosystem Services Water provisioning Water Quality Production Pools Decomposition Flows Ag-/De-gradation Land-Water Interactions ERFs ETFs Riparian wetland ES W-ESP Decision Support System • Cost • Optimization • Market Forces • Valuation Societal Response & EPA Policy Actions Tradable Ecosystem Service Units Futures & Trading Analyses
Direct drivers (forcing variables) of ecosystem change • Changes in land use • Pollution • Climate change • Invasive species • Overexploitation • Other World Resources Institute
ERFs, ETFs Have Many Dimensions Example 1:soil texture modifies the effects of the 3 stressors at left Toggle with previous slide Low Sand% Low Sand% High Sand% ? ? High Sand% Stream Nitrate ? Soil Carbon Crop Yield High Sand% Low Sand% N Fertilization N Fertilization N Fertilization Low Sand% Low Sand% High Sand% ? Soil Carbon ? Crop Yield ? High Sand% Low Sand% High Sand% Low Sand% High Sand% Low Sand% Climate ? ? ? Crop Yield Soil Carbon High Sand% Low Sand% High Sand% Carbon Sequestration Food Production Water Quality Fertilization Stream Nitrate Tillage Tillage Tillage Tillage Stream Nitrate Drought Index Drought Index Drought Index
ERFs, ETFs Have Many Dimensions Example 2: the 3 stressors at left have interactive effects Water Quality Carbon Sequestration Food Production Low Tillage High Tillage ? Stream Nitrate Soil Carbon High Tillage ? Low Tillage Low Tillage ? Fertilization Crop Yield N Fertilization N Fertilization High Tillage N Fertilization Low Drought Index Low Drought Index Soil Carbon Stream Nitrate ? ? High Drought Index Low Drought Index High Drought Index Tillage ? Crop Yield Tillage Tillage High Drought Index Tillage High N Fert High N Fert High N Fert Climate ? ? ? Crop Yield Soil Carbon Low N Fert Low N Fert Low N Fert Stream Nitrate Drought Index Drought Index Drought Index
Ecosystem Research Program LTG 5 By 2013 ERP will complete site-specific demonstration projects that illustrate how regional and local managers can use alternative future scenarios to proactively conserve and enhance ecosystem goods and services in order to benefit human well-being and to secure the integrity and productivity of ecological systems.
Place Based Sites • Tampa Bay – warm humid, 5 or so small watersheds, rapid urbanization, unique estuarine habitat, and high recreational use. • Midwest – temperate, multi-state, bread basket, biofuel production and processing pressures, many unique habitats. • Pacific Northwest – cool moist, strong policy and planning element for sustainable economic growth, focus on riparian forest. • Coastal Carolinas – warm humid, wetlands loss and sea level rise, impacts to sensitive habitats and protected species.
Working Across Multiple Locations Provides opportunities to: • Test similar methods in different locations • Look at urban to rural gradient • Evaluate variety of stressors • Research ways to upscale results • Develop coupled ecological/economic modeling/tools • Reach out to larger audience
Nutrient Cycling Productivity Biodiversity Water Quantity Water Quality Carbon Storage Sense of Place What are the common functions and services across places? What are the likely contributions to human well being? Contribution to Well Being Existence Value Climate Mitigation Land Value Flood Control Human Health Food/Fiber Energy Potable Water Recreation Cultural Aesthetics
Table 1. Common Ecosystem Services for Place Based Study Sites