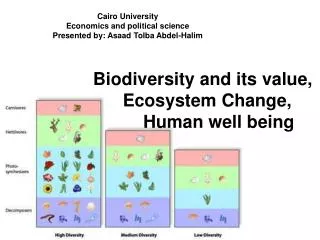
The Economic Value of Ecosystem Services and Human Well-Being
160 likes | 348 Vues
This comprehensive analysis explores the interconnectedness of ecosystem services and human welfare, highlighting the financial implications of environmental degradation. It discusses the willingness to pay for environmental amenities and the costs associated with lost welfare due to ecological harm. A meta-analysis reveals a median wetland value of US$170 per hectare, showcasing the essential benefits of ecosystems such as flood control and recreational opportunities. The document stresses the importance of equitable cost-benefit sharing and innovative payment for ecosystem services to incentivize conservation efforts.

The Economic Value of Ecosystem Services and Human Well-Being
E N D
Presentation Transcript
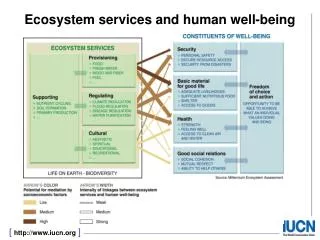
Awareness raising Willingness-to-pay for environmental amenities Welfare loss due to environmental degradation Opportunity cost of environmental protection Example: A meta-analysis of wetland valuation studies reports a median value of US$170 per hectare per year based on 89 studies covering 63 million ha. This is extrapolated to US$70 billion per year for a global wetland area of 12.8 million km2. The highest values were recreational opportunities and amenities, flood control and storm buffering. Source: Schuyt, K. and Brander, L. 2004. The Economic Values of the World’s Wetlands. WWF-International and the Institute for Environmental Studies, Vrije Universiteit, Gland/Amsterdam (January). Why value ecosystems?
Resource allocation Land use decisions Resource pricing (e.g. park entry fees) Fiscal reform (perverse subsidies) Payments for ecosystem services Example: The costs of reducing non-point water pollution in the Catskill-Delaware watershed (serving New York City) were less than the cost of installing new filtration capacity. The latter was estimated at US$4 to 6 billion investment, plus $250 million annual operating costs, compared to $1 billion for integrated resource management to provide the same benefits through land purchases, regulatory reform, stakeholder dialogue, and payments for farm-level pollution control (e.g. manure disposal). Source: Appleton, A.F. 2002. “How New York City Used an Ecosystem Services Strategy Carried out through an Urban-Rural Partnership to Preserve the Pristine Quality of Its Drinking Water and Save Billions of Dollars”, paper presented at Katoomba V, November 2002, Tokyo, Japan. Why value ecosystems? (continued)
Why value ecosystems? (continued) 3. Equitable sharing of costs and benefits Distribution of Net Present Value among stakeholders of Leuser National Park Note: NPV over the period 2000-2030 at a discount rate of 4% Source: van Beukering, Pieter. 2003. “The economic value of tropical forest and its consequences for setting up payment schemes for environmental services: A comparison between the Leuser National Park (Indonesia) and the Iwokrama Forest (Guyana)” paper presented at the Congress on Globalisation, localisation and tropical forest management in the 21st century, 22-23 October 2003, Roeterseiland, Amsterdam, the Netherlands.
Market Valuation Techniques Non-market Valuation Techniques Behavioural Linkages Physical Linkages Dose-response Functions Revealed Preference Stated Preference Change in Outputs (productivity) Hedonic Property Analysis Contingent Valuation Method Conjoint Analysis (choice models) Change in Inputs (resource costs) Hedonic Wage-risk Analysis Cost-of-illness Travel Cost Method Replacement Cost Preventative Expenditure Benefit Transfer
Valuing forests in Europe (stated preference) Adapted from: EFTEC. 2002. Populating the Environmental Valuation Reference Inventory: 40 European valuation studies. Final report submitted to European Commission, DG Environment.
Total economic value of conservation Source: Pagiola et al. (2004)
Methods are adequate but data is lacking Most studies are site-specific, focus on a single good or service at one point in time, and assume fixed prices. Most studies focus on the direct use values of marketed products, for which data can be obtained more easily. Ecosystem services are rarely or unreliably valued, due to poor data on biophysical relationships. Non-use values are difficult to define, tricky to estimate and even harder to capture, due to free-riding and a lack of accepted transfer mechanisms. Lessons and challenges of valuation
More routine valuation by governments (as part of normal statistical work) Better bio-physical data on contribution of ecosystem services to market production Reform of subsidies (agriculture, water) Liability for ecological damage Payment for ecosystem services The way forward…
Brazil – A water utility in the city of Sao Paulo pays 1% of total revenues for the restoration and conservation of the Corumbatai watershed. Funds are used to establish tree nurseries and for reforestation along riverbanks. China – Water and hydroelectric companies pay 0.01 Yuan per tonne of water, and 0.005 Yuan per Kilowatt of electricity, to farmers who plant and manage trees to maintain dry season flows and improve water quality. Ecuador – Municipal water companies in Quito, Cuenca and Pimampiro impose levies on water sales. Revenues are invested in conservation upstream and payments to forest owners. Payments for watershed protection are increasingly common
Conservation-oriented activity Conservation with payment for service Payment Minimum payment Maximum payment Payments for ecosystem services:Easy in theory; hard in practice Conventional practice Benefits to producers External costs Source: World Bank 2002
Buying the resource outright is too expensive (and unnecessary) Payments are less expensive than alternative technical fixes (e.g. infrastructure) Provision of the desired service is verifiable and enforceable Transaction costs are not prohibitive Someone is willing to pay the price Payments for ecosystem services are appropriate when… Source: Kousky, C. 2005. Choosing from the Policy Toolbox, http://ecosystemmarketplace.net/ accessed on 5.12.2005.
Environmental liability and compensation The mitigation hierarchy: Avoid Reduce, moderate, minimize Rescue (relocation, translocation) Repair, reinstate, restore Compensate/offset Reduce impacts towards zero residual Positive contributions (Net biodiversity benefit)
But first reform perverse subsidies! OECD (2002)