Calculate Range of Data Sets | Understand Variability in Data
Learn how to find the range of waiting times in different data sets. Enhance your data analysis skills by mastering range calculation methods. Improve your statistical knowledge today!

Calculate Range of Data Sets | Understand Variability in Data
E N D
Presentation Transcript
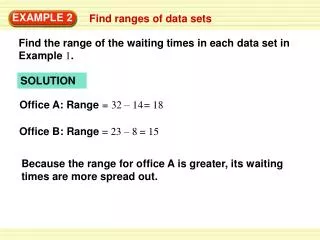
EXAMPLE 2 Find ranges of data sets Find the range of the waiting times in each data set in Example 1. SOLUTION Office A: Range= 32 – 14 = 18 Office B: Range= 23 – 8 = 15 Because the range for office A is greater, its waiting times are more spread out.
The correct answer is D. ANSWER – (14 22)2 – + (17 22)2 290 Office A: = 5.7 = 9 9 ... – + + (32 22)2 ... – – (8 16)2+ (11 16)2+ + (23 16)2 – Office B: 182 = 4.5 9 = 9 EXAMPLE 3 Standardized Test Practice SOLUTION
Standard deviation ... (x1 – x)2 + (x2 – x)2 + + (xn – x)2 ... = (2 – 7.4)2 + (4– 7.4)2 + + (15 – 7.4)2 = n 10 148.4 = 10 for Examples 2 and 3 GUIDED PRACTICE 2.Find the range and standard deviation of the data set in Guided Practice Exercise 1 on page 745. SOLUTION Range= 15 – 2 = 13 = 3.8