example 2
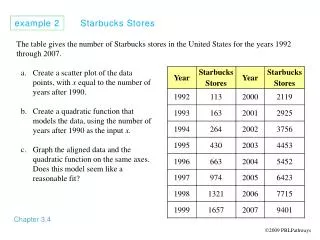
example 2. Health Service Employment. Chapter 2.2. The table gives the number of full- and part-time employees in offices and clinics of dentists for selected years between 1990 and 2005.


example 2
E N D
Presentation Transcript
example 2 Health Service Employment Chapter 2.2 The table gives the number of full- and part-time employees in offices and clinics of dentists for selected years between 1990 and 2005. Draw a scatter plot of the data with the x-value of each point representing the number of years after 1990 and the y-value representing the number of dental employees (in thousands) corresponding to that year. Graph the equation on the same graph as the scatter plot and determine if the line appears to be a good fit. Draw a “visual fit” line that fits the data well (a piece of spaghetti or pencil lead over your calculator screen works well) and select two points on that line. Use these two points to write an equation of the “visual fit” line. Determine whether this line or the one from part (b) is the better fit. 2009 PBLPathways
The table gives the number of full- and part-time employees in offices and clinics of dentists for selected years between 1990 and 2005. Draw a scatter plot of the data with the x-value of each point representing the number of years after 1990 and the y-value representing the number of dental employees (in thousands) corresponding to that year. Graph the equation on the same graph as the scatter plot and determine if the line appears to be a good fit. Draw a “visual fit” line that fits the data well (a piece of spaghetti or pencil lead over your calculator screen works well) and select two points on that line. Use these two points to write an equation of the “visual fit” line. Determine whether this line or the one from part (b) is the better fit.
Draw a scatter plot of the data with the x-value of each point representing the number of years after 1990 and the y-value representing the number of dental employees (in thousands) corresponding to that year.
Draw a scatter plot of the data with the x-value of each point representing the number of years after 1990 and the y-value representing the number of dental employees (in thousands) corresponding to that year.
Draw a scatter plot of the data with the x-value of each point representing the number of years after 1990 and the y-value representing the number of dental employees (in thousands) corresponding to that year.
Draw a scatter plot of the data with the x-value of each point representing the number of years after 1990 and the y-value representing the number of dental employees (in thousands) corresponding to that year.
Graph the equation on the same graph as the scatter plot and determine if the line appears to be a good fit.
Graph the equation on the same graph as the scatter plot and determine if the line appears to be a good fit.
Draw a “visual fit” line that fits the data well (a piece of spaghetti or pencil lead over your calculator screen works well) and select two points on that line. Use these two points to write an equation of the “visual fit” line. Determine whether this line or the one from part (b) is the better fit.
Draw a “visual fit” line that fits the data well (a piece of spaghetti or pencil lead over your calculator screen works well) and select two points on that line. Use these two points to write an equation of the “visual fit” line. Determine whether this line or the one from part (b) is the better fit.
Draw a “visual fit” line that fits the data well (a piece of spaghetti or pencil lead over your calculator screen works well) and select two points on that line. Use these two points to write an equation of the “visual fit” line. Determine whether this line or the one from part (b) is the better fit.
Draw a “visual fit” line that fits the data well (a piece of spaghetti or pencil lead over your calculator screen works well) and select two points on that line. Use these two points to write an equation of the “visual fit” line. Determine whether this line or the one from part (b) is the better fit. (12.479, 731.218) (3.096, 563.934)
Draw a “visual fit” line that fits the data well (a piece of spaghetti or pencil lead over your calculator screen works well) and select two points on that line. Use these two points to write an equation of the “visual fit” line. Determine whether this line or the one from part (b) is the better fit. (3.096, 563.934) (12.479, 731.218)
Draw a “visual fit” line that fits the data well (a piece of spaghetti or pencil lead over your calculator screen works well) and select two points on that line. Use these two points to write an equation of the “visual fit” line. Determine whether this line or the one from part (b) is the better fit. (3.096, 563.934) (12.479, 731.218)
Draw a “visual fit” line that fits the data well (a piece of spaghetti or pencil lead over your calculator screen works well) and select two points on that line. Use these two points to write an equation of the “visual fit” line. Determine whether this line or the one from part (b) is the better fit. (3.096, 563.934) (12.479, 731.218)
Draw a “visual fit” line that fits the data well (a piece of spaghetti or pencil lead over your calculator screen works well) and select two points on that line. Use these two points to write an equation of the “visual fit” line. Determine whether this line or the one from part (b) is the better fit. (3.096, 563.934) (12.479, 731.218)
Draw a “visual fit” line that fits the data well (a piece of spaghetti or pencil lead over your calculator screen works well) and select two points on that line. Use these two points to write an equation of the “visual fit” line. Determine whether this line or the one from part (b) is the better fit. (3.096, 563.934) (12.479, 731.218)
Draw a “visual fit” line that fits the data well (a piece of spaghetti or pencil lead over your calculator screen works well) and select two points on that line. Use these two points to write an equation of the “visual fit” line. Determine whether this line or the one from part (b) is the better fit. (3.096, 563.934) (12.479, 731.218)
Draw a “visual fit” line that fits the data well (a piece of spaghetti or pencil lead over your calculator screen works well) and select two points on that line. Use these two points to write an equation of the “visual fit” line. Determine whether this line or the one from part (b) is the better fit. (3.096, 563.934) (12.479, 731.218)
Draw a “visual fit” line that fits the data well (a piece of spaghetti or pencil lead over your calculator screen works well) and select two points on that line. Use these two points to write an equation of the “visual fit” line. Determine whether this line or the one from part (b) is the better fit. (3.096, 563.934) (12.479, 731.218)
Draw a “visual fit” line that fits the data well (a piece of spaghetti or pencil lead over your calculator screen works well) and select two points on that line. Use these two points to write an equation of the “visual fit” line. Determine whether this line or the one from part (b) is the better fit.