Starbucks Stores Analysis: Quadratic Model & Projections
Analyzing Starbucks stores in the US from 1992-2007 with a quadratic function model. Estimate store count in 2006 & 2010 for reliability assessment.

Starbucks Stores Analysis: Quadratic Model & Projections
E N D
Presentation Transcript
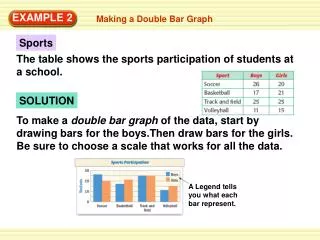
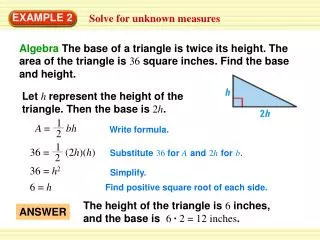
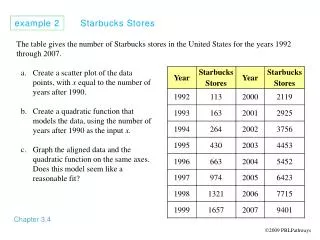
example 2 Starbucks Stores Chapter 3.4 The table gives the number of Starbucks stores in the United States for the years 1992 through 2007. Create a scatter plot of the data points, with x equal to the number of years after 1990. Create a quadratic function that models the data, using the number of years after 1990 as the input x. Graph the aligned data and the quadratic function on the same axes. Does this model seem like a reasonable fit? 2009 PBLPathways
The table gives the number of Starbucks stores in the United States for the years 1992 through 2007. Create a scatter plot of the data points, with x equal to the number of years after 1990. Create a quadratic function that models the data, using the number of years after 1990 as the input x. Graph the aligned data and the quadratic function on the same axes. Does this model seem like a reasonable fit?
The table gives the number of Starbucks stores in the United States for the years 1992 through 2007. Use the model to estimate the number of stores in 2006. Is the estimate close to the actual number? Use the model to estimate the number of stores in 2010. Discuss the reliability of this estimate.
The table gives the number of Starbucks stores in the United States for the years 1992 through 2007. Create a scatter plot of the data points, with x equal to the number of years after 1990.
The table gives the number of Starbucks stores in the United States for the years 1992 through 2007. Create a scatter plot of the data points, with x equal to the number of years after 1990.
The table gives the number of Starbucks stores in the United States for the years 1992 through 2007. Create a scatter plot of the data points, with x equal to the number of years after 1990.
Create a quadratic function that models the data, using the number of years after 1990 as the input x.
Create a quadratic function that models the data, using the number of years after 1990 as the input x.
Graph the aligned data and the quadratic function on the same axes. Does this model seem like a reasonable fit? y x
Use the model to estimate the number of stores in 2006. Is the estimate close to the actual number? y (16, 7715) x
Use the model to estimate the number of stores in 2006. Is the estimate close to the actual number? y (16, 7715) x
Use the model to estimate the number of stores in 2006. Is the estimate close to the actual number? y (16, 7715) x
Use the model to estimate the number of stores in 2006. Is the estimate close to the actual number? y (16, 7715) x
Use the model to estimate the number of stores in 2010. Discuss the reliability of this estimate. y x
Use the model to estimate the number of stores in 2010. Discuss the reliability of this estimate. y x
Enter the data To enter the data, press . Under the EDIT menu, press 1 or hightlight 1: Edit... to enter the statistics editor. In the first column, enter the aligned data for the years after 1990. After each row, press or to go to the next line. The data in the column are referred to as list 1 or L1.
After the last year, press to go to the second column. In the second column, enter the number of Starbucks stores followed by or to go to the next row. The data in the column are referred to as list 2 or L2.
After you have entered all of the numbers, check to insure that each year has a corresponding number of stores. To the right, you’ll notice that each column has the same number of data. If the numbers of data in the columns don’t match, you’ll get an error when you graph the scatter plot.
Set up the scatter plot Press . To accommodate the data we just entered, modify the window so it appears like the one to the right. Now we need to turn on the scatter plot. Press to enter the STAT PLOT menu. There are three statistical plots on your calculator that you can plot your data on. To select Plot 1, press .
In the Plot 1 menu, move your cursor around this menu using , , , and . Make sure that Plot 1 is turned on by pressing when the cursor is over On. Make sure the type is highlighted as a scatter plot as shown to the right. Under Xlist and Ylist, make sure that L1 and L2 appears. If not, move the cursor to Xlist and press or move the cursor to Ylist and press .
Highlight one of the options for Mark and press . This is the mark that will be plotted in the scatter plot. Press to see the scatter plot. If any other graphs appear on the scatter plot, you may have to clear them from the equation editor by pressing . To clear an equation, move the cursor to the equation’s line and press .
Find the quadratic model Press to enter the statistics menu. Use to highlight CALC along the top of the screen. Press 5 or highlight 5: QuadReg and press . The QuadReg command will be pasted to the home screen.
We need to supply the calculator with the lists we are finding a quadratic model for. Press to supply the names of the lists separated by commas. The final argument we want to enter is the location the model will be placed in the equation editor. Press . Move the cursor to Y-VARS using the button. Press 1 or highlight 1: Function…
Highlight the location in the equation editor you want to paste to and press . If you highlighted Y1 above, it will be pasted to the home screen at the end of the QuadReg command. This command calculates the quadratic model of the data in lists L1 and L2 and pastes the equation into Y1.
Press to calculate the model. Press to see the data and the corresponding quadratic model.
Generate values from the model Press to set up a table for the model. TblStart and Tbl are not important, but make sure Ask is highlight next to Indpnt by moving the cursor and pressing .
Press . In the X column, type to generate the corresponding y values from the model in Y1. These values estimate the number of Starbucks stores in 2006 and 2010 according to the quadratic model.