Download
1 / 36
380 likes | 791 Vues
The FAO outlook to 2030/2050 Production, Consumption, Resources Global Perspective Studies Unit Food and Agriculture Organization of the United Nations. Part 1: The outlook to 2030/2050. Population growth to continue, but at a slower pace. 12.0. 0.09. 0.08. 0.07. 9.0. 0.06. 0.05.

E N D
The FAO outlook to 2030/2050 Production, Consumption, Resources Global Perspective Studies Unit Food and Agriculture Organization of the United Nations
Population growth to continue, but at a slower pace 12.0 0.09 0.08 0.07 9.0 0.06 0.05 Annual increments (billions) 6.0 Total population (billions) 0.04 0.03 3.0 0.02 0.01 0.0 0.00 1750 1800 1850 1900 1950 2000 2050 Source: UN, World Population Assessment 2006
fewer OECD distortions lower stocks high energy prices weather/climate export restrictions low demand elasticities more hunger, uncertainty R&D, GR low energy prices high government stocks OECD support, export subsidies
Energy market (TPES): nearly 500 EJ Biomass: 50 EJ (80% in developing countries) Biofuels: 2.1 EJ, on ca. 26 million ha Transport energy needs: ca. 95 EJ Crop area to cover transport energy needs: >1000 million ha, i.e. 2/3 of global crop area. Energy market is large, creates perfectly elastic demand for agricultural produce at break-even points (parity prices). How big is the energy market?
P End of the treadmill? The new agricultural price paradigm D4 D5 D3 D*5 D2 D1 T1 (bio)energy demand perfectly elastic demand at parity prices T2 T3 S1 T4 S2 S3 S6 S4 S5 Q
Will a shift to 2nd generation biofuels bring alleviation/solution?
Energy market is big relative to the food market Food – fuel competition is competition for resources (land, water) (not between food and feed feedstocks!) More efficient feedstocks would help reduce area at limited demand, but at potentially unlimited demand, demand for feedstocks will rise (potentially in a big way). More R&D in more efficient biofuel feedstocks may have unexpected and even unintended area expansion effects: Beware of what you are wishing for/investing in! More R&D in more efficient feedstocks?
How much land is in use, how much is available now and in 2050? 1200 1066 1031 1000 874 Suitable for rainfed crop production 800 Arable land use, 2005 million ha Arable land use, 2050 600 497 366 400 387 220 265 200 237 236 99 212 203 86 0 Latin America sub-Saharan East Asia South Asia Near Industrialized Transition and Africa East/North countries Economies Caribbean Africa Source: Global Perspective Studies Unit, FAO
Arable land expansion Land with (rainfed) crop production potential (million ha) Source: AEZ 2002
Table 7 Total arable land: data and projections Irrigated land expansion and water use Area equipped for irrigation
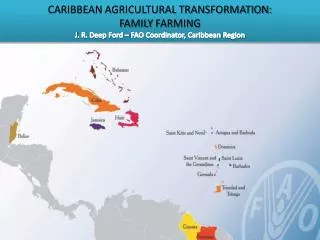
287 mha, 219 mha irrigated in developing countries 70% of all freshwater use 20% of cultivated land in DCs 40% of agricultural production in DCs 60% of cereal production in DCs How important is water for agriculture and food security?
Is there enough water? Irrigation water withdrawal as a share of renewable water resources (%) 70 Today in 2030 60 50 40 30 20 10 0 East Asia South Asia Latin America All developing countries sub-Saharan Africa Near East/North Africa Source: Global Perspective Studies Unit, FAO
still significant water use efficiency gains to be had Irrigation efficiency by region (in %) 100 90 Today in 2030 80 70 60 50 40 30 20 10 0 All developing East Asia South Asia s-Saharan Africa Latin America Near East/North Africa
Sources of growth for the future in developing countries 2006-2050 71% 8% 21% Yields Cropping Intensity Area Source: Global Perspective Studies Unit, FAO
Yield increases and yield gaps Wheat yields: 16 countries with over 4 million tonnes of mainly rainfed wheat production
Iowa maize yield 61-90; 90-08 12 9 b=206 kg/ha/yr 6 Maize yield (t/ha) 2 R =0.61*** b=95 kg/ha/yr 3 2 R =0.51*** 0 1960 1970 1980 1990 2000 2010 Year
∆Yield biophysical changes: • highertemperatures and more evaporation • more precipitation and higher rainfall variability • more frequent extreme weather events higher production variability • inundation of coastal areas • melting glaciers, water circulation, irrigation potentials • higher atmospheric CO2 concentration impacts on agriculture/food • high latitude areas: ↑yields for GMT <2.5°C, ↓yields >2.5°C GMT • low latitude areas: ↓yields even for ↑temp 1-2°C • globally production neural up to +2C GMT, but lower production in low-latitude areas • Higher yield variability due to weather extremes • high latitudes: more land suitable for agricultural production (+160 million ha), low latitudes: less land for agricultural production (-110 million ha) • CO2 fertilization effect, but uncertain • fire risks, pests and diseases, food safety, e-coli, malaria, etc.
Summary and conclusions • Future output challenges • +70% more food production to 2050, but slow down in growth • overall enough resources (land, water, genetics), but growing regional/local resource pressures (land, water) • energy market huge, energy demand cannot be met by agriculture • climate change to increase pressure on the resource base of the poor • more productive agriculture needed to fight hunger, poverty • R&D needs to meet the challenges • Invest more specifically to address the needs of the poor (abiotic stress, crops of the poor) • Divergent R&D needs in developed and developing countries: rebalance productivity growth with other goals such as nutrition, environment, etc. • CC: R&D to promote productivity growth, to minimize acreage expansion • CC: R&D for abiotic stresses (drought tolerance, etc.) • but prioritize mitigation over adaptation (timing, financing); seek win-win (CA/NT) • Bioenergy: R&D investment in more efficient biofuel feedstocks? Unintended area expansion effects possible! • Timing, sequencing: Invest steadily, avoid pro-cyclical action and price movements; synchronize R&D investment with other measures (water pricing, water use efficiency); take into account the long gestation periods. • Organize/co-ordinate R&D: Combine expertise of the private sector with needs and constraints in developing countries: PPPs, humanitarian use licenses, etc
Thanks. Questions?