CTD, Cores, Plankton
CTD, Cores, Plankton. to detect how the conductivity and temperature of the water column changes relative to depth. Other sensors can be added Easy to use Turn it on Deploy it by allowing to soak (45-60 sec) then raise to surface and begin downcast.


CTD, Cores, Plankton
E N D
Presentation Transcript
to detect how the conductivity and temperature of the water column changes relative to depth. Other sensors can be added Easy to use Turn it on Deploy it by allowing to soak (45-60 sec) then raise to surface and begin downcast. Once at the bottom, raise back to surface (upcast) Retrieve it and turn it off Make sure all probes stay moist when out of the water CTD (conductivity, temperature, depth)
Obtain Data • Seasoft/Seasave • We are only interested in the downcast (Sturgeon’s law) • Find corresponding scan numbers – getting rid of the soak time scan numbers and the upcast • Screen plot and hard copy • Table of averaged values
Dissolved Oxygen • Nonconservative gas • its concentration changes by biological processes in addition to mixing processes. • Organisms consuming oxygen (respiration) will cause oxygen concentration to decrease as the water mass moves away from its source. • Deep ocean gets its oxygen from water masses that form in northern and southern latitudes. These water masses, formed at the surface, sink because they are dense. • Units: micromoles per kg • Solubility decreases with increasing temperature and salinity • The lower the temperature, the higher the solubility; and, the higher the salinity the lower the solubility. • Photosynthesis produces DO (in the photic zone) and this process can lead to oxygen concentrations that exceed its solubility. Some surface water, or water just below the surface layer, can exceed oxygen solubility by 10 to 20% (supersaturation). • Respiration leads to a reduction in the quantity of DO – usually reaches minimums well below the photic zone. Below that minimum we often see another increase due to deep water mixing. • Can be used to trace water masses
Calculating % Saturation • If the DO is 8.0 mg/l, what is the % sat? • Get solubility of oxygen from nomogram • Must know temp and salinity
Jubilee • If wind direction, surface temperature, salinity, and tidal variation interact in ways that allow or promote a jubilee, the situation can develop rather quickly. • During jubilees fishes present in about a 2m contour along the eastern shore are trapped between the shore and an advancing water mass low in dissolved oxygen • The water at the surface and very close to shore usually has enough oxygen to support them for the short duration of most jubilees. Accumulated organic matter on the bay floor can cause a rapid depletion of DO (hypoxia) which forces demersal animals to come to shore or surface in search of oxygen.
Sediment Sampling • Grabs • designed to collect an accurate representative sample of the sediment bottom • bite of the sampler should be deep enough so all depths are sampled equally • closing mechanism is required to completely close and hold the sample as well as prevent wash-out during retrieval • during descent the sampler should be designed to minimize disturbance of the topmost sediment by the pressure wave as it is lowered to the bottom. • Grabs and corers are appropriate sampling tools for bottom sediments ranging from mud and silt to coarse sand and small stones, but not for hard-packed sandy bottoms or coarse bottoms with cobbles. • Grab and core sampling is the most quantitative method, as the size of the area sampled is determined by their opening and thus can be identified very accurately. • Acoustic • reliable sediment mapping information at spatial resolutions better than using sediment grabs (figure 3). • used in some situations as a proxy for % mud • acoustic data alone cannot be used to interpret particle size composition (i.e. the proportions of each sediment fraction).
Peterson Grab Eckman Grab Shipek Grab Smith-McIntyre Grab
Dredge • used on similar bottom types as grabs and corers, are more appropriate for estimating the densities of low-abundance benthic species because they cover much larger areas (up to several hundred square meters). • semi-quantitative owing to the problem of estimating the area sampled accurately • Qualitative – more common • Most common method for sampling rocks on the sea floor • used in marine geology primarily by the “hard-rock” community interested in the recovery of basement rock samples from the unsedimented deep ocean floor
Core Sampling: What are Characteristics of good core samplers?• Perpendicular placement: The core sampler must make a vertical or straight entry into sediments to secure a reliably representative cross-section sample.• Penetration: It must penetrate the sediments you expect to find and adaptable for many field situations. • Core retention: There should be minimal loss of any part of the sample during return to the surface.• Maximum sample validity: This means: a. Samplers intended for layered sediments should obtain cores showing minimum disturbance of layers by compression or by displacement around the circumference. b. Samplers intended to obtain bottom sediments and their resident fauna need a design which causes minimum displacement or escape of fauna during sampling.• Simplicity: Purchase the simplest instrument capable of producing the type of samples you require.
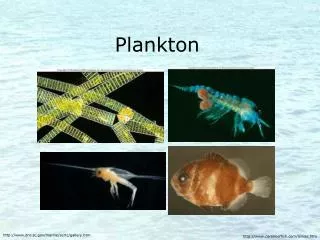
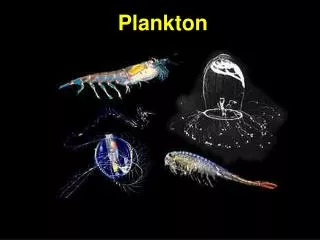
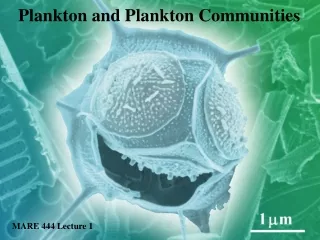
Plankton Sampling • Phytoplankton • Very small – require very fine mesh • Mostly done with water samples • Niskin bottles / Rosette • Pump • Zooplankton • Mostly sampled with nets • Different sizes – different mesh • Mininess • Volume calculations
Plankton Pump Niskin Bottle Rosette
Phytoplankton net Ring net with flowmeter BIONESS Tucker Trawl
Calculate volume sampled • Find the radius of the mouth of your net – cylindrical net • calculate the area of the mouth of your net (hint: area = π r2) where π = 3.14 and r = radius • Take the area of the mouth of the net and multiply it by how far the plankton net traveled through the water • If the research vessel you are using to take plankton samples is moving at a rate of 1 nautical mile/hour, how far will the plankton net be towed through the water if you tow it for 15 minutes? (hint: Convert nautical miles into meters. 1 nautical mile = 1,853 meters)
Calculate depth with wire angle Angle of Cable (θ) Cable Length (l) ? Depth (d) If using a calculator, make sure that your mode is set to degrees, not radians! Net