Download
1 / 46
460 likes | 651 Vues
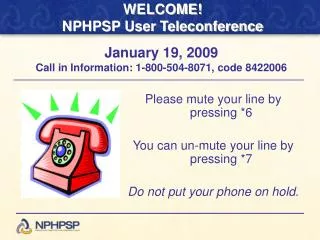
WELCOME! NPHPSP User Teleconference. Please mute your line by pressing *6 You can un-mute your line by pressing *7 Do not put your phone on hold. January 19, 2009 Call in Information: 1-800-504-8071, code 8422006. WA. MT. ND. ME. OR. MN. VT. NH. ID. SD. WI. NY. MA. WY. MI. RI.

E N D
WELCOME!NPHPSP User Teleconference Please mute your line by pressing *6 You can un-mute your line by pressing *7 Do not put your phone on hold. January 19, 2009Call in Information: 1-800-504-8071, code 8422006
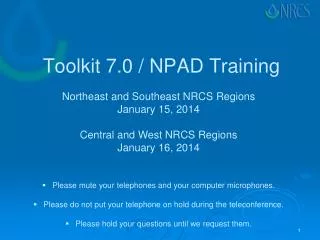
WA MT ND ME OR MN VT NH ID SD WI NY MA WY MI RI IA PA NE NV CT OH UT IL IN NJ CO WV CA KS VA DE MO KY MD NC TN OK AZ NM AR SC GA MS AL TX LA AK FL HI NPHPSP State Instrument Use(Thru December 2009, n = 27 states + DC) NH MA RI CT *Also includes sites using field test versions of the NPHPSP State Public Health System Performance Assessment.
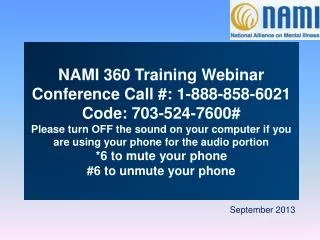
WA MT ND ME OR MN VT NH ID SD WI NY MA WY MI RI IA PA NE NV CT OH UT IL IN NJ CO WV CA KS VA DE MO KY MD NC TN OK AZ NM AR SC GA MS AL TX LA AK FL Significant Use (67% or greater) Moderate Use (33% - 66%) Limited Use (1% - 32%) NPHPSP Local Instrument Use(Thru December 2009) HI *Also includes sites using field test versions of the NPHPSP Local Public Health System Performance Assessment.
WA MT ND ME OR MN VT ID SD WI NY WY MI IA PA NE NV OH UT IL IN CO WV CA KS VA MO KY NC TN OK AZ NM AR SC GA MS AL TX LA AK FL Significant Use (67% or greater) Moderate Use (33% - 66%) Limited Use (1% - 32%) NPHPSP Governance Instrument Use(Thru December 2009) NH MA RI CT NJ DE MD HI No Boards of Health *Also includes sites using field test versions of the NPHPSP Local Public Health Governance Performance Assessment.
National Use of the NPHPSP Local Instrument Julia Joh Elligers, MPH Senior Analyst NACCHO January 19, 2010 Findings from the 2005 & 2008 National Profiles of Local Health Departments
Objective To describe the characteristics of local health departments (LHDs) that use the NPHPSP local instrument
Data Sources NACCHO’s 2005 & 2008 National Profile of Local Health DepartmentsSurveys Comprehensive survey-based datasets on LHDs in the U.S. Includes information on topics such as services, finance, workforce, and organization. www.naccho.org/profile
Profile Survey NPHPSP Question Please indicate whether and how you have used any of the following tools in a community health assessment or health improvement plan in the past three years.
LHDs Use of NPHPSP in the Past 3 Years 1All LHDs=All LHDs who responded to related Profile question.
Potential Factors Associated with NPHPSP Use Jurisdiction Type Population Size Financial Capacity Staff Capacity
Potential Factors Associated with NPHPSP Use Jurisdiction Type: More use among cities and multi-jurisdictions Population Size: More use among LHDs with larger population sizes Financial Capacity: Users had more per capita expenditures than non users (2005 only) Staff Capacity: Users had more FTEs than non users
Model Logit model Dependent variable: Probability of NPHPSP implementation (excludes LHDs that referenced). Independent variables: Jurisdiction type, population size, per capita expenditures, FTEs Control variable: State support
Things to Keep in Mind Strengths Describes the relative effect of influential factors, holding other variables constant Limitations Does NOT tell us why certain factors influence implementation. Does not reflect quality of assessment implementation
Interpretation Examples • The odds of NPHPSP use is 1.27 greater for county health departments than for town health departments, holding other variables constant. • The odds of NPHPSP use is 1.86 greater for LHDs with populations between 25,000-49,999 than for LHDs with populations less than 25,000, holding other variables constant. • A $1 increase in per capita expenditures increases the odds of NPHPSP implementation by 1.01, holding other variables constant. (i.e. no change in odds) • State support increases the odds of implementation by a factor of 3.40, holding other variables constant.
NPHPSP Program Considerations Continued and more focused sensitivity to differences among LHDs with different jurisdictions and population sizes Continued technical assistance and resource support to LHDs concerned about financial and staffing limitations Further investigation into what these results could mean in light of accreditation
In Sum… • The odds of use is much greater for cities and multi-jurisdictions as compared to towns. • The odds of use increases with population size. • There is really no increase in odds of use with per capita expenditures and FTEs. • As expected, state support increases of odds of use. • A greater percentage of NPHPSP users indicated they would apply for accreditation than non-NPHPSP users. • Overall, results give us a national picture of performance standards use.
Questions for Your Consideration • In reflecting on the results, what other types of research questions would you like answered? • Why do you think the odds of NPHPSP use are greater in cities and multi-jurisdictions as compared to towns and townships? • Why do you think the odds of NPHPSP use are greater among LHDs with larger population sizes? • (Remember, FTEs and per capita expenditures were not statistically significant.)
References • NACCHO’s 2005 & 2008 National Profile of Local Health DepartmentsSurveys, www.naccho.org/profile • NACCHO’s NPHPSP Website, www.naccho.org/topics/infrastructure/NPHPSP • NACCHO’s MAPP LPHSA Resources, www.naccho.org/mapp, select “Clearinghouse of Resources” and “Local Public Health System Assessment” • CDC’s NPHPSP Website, www.cdc.gov/od/ocphp/nphpsp
Contact Information Julia Joh Elligers, MPH Senior Analyst, Public Health Infrastructure and Systems National Association of County and City Health Officials (202) 507-4234 jjoh@naccho.org www.naccho.org
Results from ASTHO’sState Public Health Survey Jennifer Jimenez, MPH NPHPSP User Call January 19, 2010
Background Define the value of state public health Promote and preserve funding Promote work of state health officials and public health Explore the use of planning, performance management and quality improvement initiatives conducted by State Public Health Agencies
Background cont. Web-based survey September 2007 - December 2007 Sent to 57 SPHA Senior Deputies Telephone and email follow-up Representatives from all 50 states and DC Response rate 89.5% No U.S. Territories responded
Survey Report and Key Findings Public Health Responsibilities Organization and Structure State Health Planning and Quality Improvement State Health Agency Workforce State Profiles
SPHA Performance Management 76% had a Performance Management process 16% (n =8) fully implemented department wide 30% (n =15) partially implemented department wide 10% (n=5) fully implemented specific programs 26% (n=13) partially implemented specific programs
SPHA Quality Improvement 82% report a QI process in place Only 10% (n=5) fully implemented department wid3 29% (n=15) partially implemented dept wide 22% (n=11) fully implemented for specific programs 33% (n=17) partially implemented for specific programs
80% of SPHAs had a State Health Improvement Plan 23.5% completed the plan in the last three years 68% developed the plan using their state health assessment 59% of state plans linked to at least one local health improvement plan Planning by SPHAs
Use of Planning and QI Tools About 86% of respondents use one/more of the major public health planning tools. HP2010 used 68% statewide and 42% with other tools. NPHPSPused 30% statewide and 30% with other tools. (44% used as a reference) Turning Point tools used 20% statewide and 30% with other tools. Agency tools used 36% statewide and 24% with other tools.
Use of Performance Measures by Types of Practice Areas Clinical (83%) MCH services STD services TB services Family Planning services Non-Clinical (56%) Data and Info systems Financial systems Health status assessment Health facility regulation HR development Customer focus and satisfaction Management practices
Summary 76% had a Performance Management process 82% report a QI process in place 80% of SPHAs had a State Health Improvement Plan About 86% of respondents use one/more of the major public health planning tools Performance measures used 83% of the time in clinical practice areas compared with 56% of the time in nonclinical areas
Study Limitations Only U.S. States responded Sample size Self report Construct validity
Next Steps for 2010 State Public Health Survey QI Module Changes Expansion of response options New questions Questions omitted
For more information on…ASTHO’s work with NPHPSP or to view the Profile of State Public Health:www.astho.orgThe NPHPSP tools and resources:http://www.cdc.gov/od/ocphp/nphpsp/Journal of Public Health Management and Practice2010, 16(1), 32-38
Thank You!Jennifer Jimenez, MPHjjimenez@astho.org(571) 527-3152
QUESTIONS? Click on ‘Q/A’ above to type in your question.