Download
1 / 13
Analyzing Data with Histograms and Stem-and-Leaf Plots
130 likes | 186 Vues
Learn how to interpret data using histograms and stem-and-leaf plots. Explore shape, center, spread, and unusual patterns in the data.
Télécharger la présentation 
Analyzing Data with Histograms and Stem-and-Leaf Plots
An Image/Link below is provided (as is) to download presentation
Download Policy: Content on the Website is provided to you AS IS for your information and personal use and may not be sold / licensed / shared on other websites without getting consent from its author.
Content is provided to you AS IS for your information and personal use only.
Download presentation by click this link.
While downloading, if for some reason you are not able to download a presentation, the publisher may have deleted the file from their server.
During download, if you can't get a presentation, the file might be deleted by the publisher.
E N D
Presentation Transcript
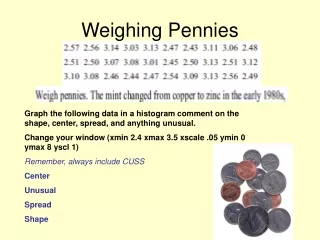
Weighing Pennies Graph the following data in a histogram comment on the shape, center, spread, and anything unusual. Change your window (xmin 2.4 xmax 3.5 xscale .05 ymin 0 ymax 8 yscl 1) Remember, always include CUSS Center Unusual Spread Shape
Stem and Leaf Plots • Create a stem and leaf plot using the number of states visited by students: • 0,1,2,3,2,2,5,3,1,7,8,10,5,8,2,2,2 • Create a stem and leaf plot using the following SAT scores • 520,530,532,490,480,482,527,528,530,550,531,530,600 • Describe the distributions of each


More Related