Figure 49.1
Figure 49.1. Planarian (flatworm). (b). Sea star (echinoderm). (c). (h). Salamander (vertebrate). Eyespot. Brain. Brain. Radial nerve. Nerve cords. Ventral nerve cord. Nerve ring. Transverse nerve. Nerve net. Figure 49.2. Segmental ganglia. (a) Hydra (cnidarian).
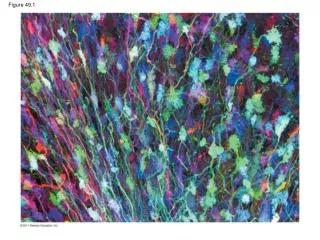

Figure 49.1
E N D
Presentation Transcript
Planarian(flatworm) (b) Sea star(echinoderm) (c) (h) Salamander(vertebrate) Eyespot Brain Brain Radialnerve Nervecords Ventralnerve cord Nervering Transversenerve Nerve net Figure 49.2 Segmentalganglia (a) Hydra (cnidarian) (d) Leech (annelid) Brain Ganglia Brain Anteriornerve ring Spinalcord(dorsalnervecord) Ventralnerve cord Brain Sensoryganglia Ganglia Longitudinalnerve cords Segmentalganglia (e) Insect (arthropod) (f) Chiton (mollusc) (g) Squid (mollusc)
Cell body ofsensory neuron indorsal rootganglion Gray matter Quadricepsmuscle Figure 49.3 White matter Hamstringmuscle Spinal cord(cross section) Sensory neuron Motor neuron Interneuron
Central nervoussystem (CNS) Peripheral nervoussystem (PNS) Brain Cranial nerves Spinal cord Ganglia outsideCNS Figure 49.4 Spinal nerves
Gray matter Figure 49.5 Whitematter Ventricles
CNS PNS Neuron VENTRICLE Astrocyte Cilia Oligodendrocyte Figure 49.6 Schwann cell Microglial cell Capillary Ependymal cell 50 m LM
Central NervousSystem(information processing) Peripheral NervousSystem Efferent neurons Afferent neurons Figure 49.7 Autonomicnervous system Motorsystem Sensoryreceptors Control ofskeletal muscle Sympatheticdivision Parasympatheticdivision Internaland externalstimuli Entericdivision Control of smooth muscles,cardiac muscles, glands
Sympathetic division Parasympathetic division Action on target organs: Action on target organs: Constricts pupilof eye Dilates pupil of eye Inhibits salivarygland secretion Stimulates salivarygland secretion Sympatheticganglia Constrictsbronchi in lungs Relaxes bronchiin lungs Figure 49.8 Cervical Slows heart Accelerates heart Stimulates activityof stomach andintestines Inhibits activity ofstomach and intestines Thoracic Inhibits activityof pancreas Stimulates activityof pancreas Stimulates glucoserelease from liver;inhibits gallbladder Stimulatesgallbladder Lumbar Stimulatesadrenal medulla Promotes emptyingof bladder Inhibits emptyingof bladder Sacral Promotes erectionof genitalia Promotes ejaculationand vaginal contractions Synapse
Brain structures in child and adult Embryonic brain regions Cerebrum (includes cerebral cortex, whitematter, basal nuclei) Telencephalon Forebrain Diencephalon (thalamus, hypothalamus,epithalamus) Diencephalon Mesencephalon Midbrain (part of brainstem) Midbrain Figure 49.9b Metencephalon Pons (part of brainstem), cerebellum Hindbrain Myelencephalon Medulla oblongata (part of brainstem) Diencephalon Cerebrum Mesencephalon Metencephalon Midbrain Midbrain Diencephalon Myelencephalon Hindbrain Pons Medullaoblongata Spinal cord Forebrain Cerebellum Telencephalon Spinal cord Child Embryo at 5 weeks Embryo at 1 month
Mesencephalon Metencephalon Midbrain Diencephalon Myelencephalon Hindbrain Figure 49.9ba Spinal cord Forebrain Telencephalon Embryo at 1 month Embryo at 5 weeks
Diencephalon Cerebrum Midbrain Figure 49.9bb Pons Medullaoblongata Cerebellum Spinal cord Child
Left cerebralhemisphere Right cerebralhemisphere Cerebral cortex Corpus callosum Figure 49.9c Cerebrum Basal nuclei Cerebellum Adult brain viewed from the rear
Figure 49.9d Diencephalon Thalamus Pineal gland Brainstem Hypothalamus Midbrain Pituitary gland Pons Medullaoblongata Spinal cord
Figure 49.10 Eye Input from nervesof ears Reticular formation Input from touch,pain, and temperaturereceptors
Key Low-frequency waves characteristic of sleep High-frequency waves characteristic of wakefulness Figure 49.11 Time: 1 hour Time: 0 hours Location Lefthemisphere Righthemisphere
Thalamus Hypothalamus Figure 49.13 Olfactorybulb Hippocampus Amygdala
Motor cortex(control ofskeletal muscles) Somatosensory cortex(sense of touch) Frontal lobe Parietal lobe Prefrontal cortex(decision making,planning) Sensory associationcortex (integration ofsensory information) Figure 49.15 Visual associationcortex (combiningimages and objectrecognition) Broca’s area(forming speech) Temporal lobe Occipital lobe Auditory cortex (hearing) Visual cortex(processing visualstimuli and patternrecognition) Cerebellum Wernicke’s area(comprehending language)
Max Figure 49.16 Hearingwords Seeingwords Min Speakingwords Generatingwords
Frontal lobe Parietal lobe Shoulder Upper arm Trunk Elbow Trunk Head Forearm Knee Neck Leg Hip Figure 49.17 Hip Wrist Elbow Hand Forearm Fingers Hand Fingers Thumb Thumb Eye Neck Nose Brow Eye Face Genitalia Lips Toes Face Teeth Gums Lips Jaw Jaw Tongue Pharynx Tongue Primarysomatosensorycortex Primarymotor cortex Abdominalorgans
Human brain Cerebrum (includingcerebral cortex) Thalamus Midbrain Figure 49.18 Hindbrain Cerebellum Avian brainto scale Cerebrum(including pallium) Avian brain Cerebellum Hindbrain Thalamus Midbrain
Synapses are strengthened or weakened in response toactivity. (a) If two synapses are often active at the same time, thestrength of the postsynaptic response may increase atboth synapses. (b) N1 N1 Figure 49.19 N2 N2
4 3 2 1 3 1 2 PRESYNAPTICNEURON Ca2 Na Mg2 Glutamate NMDA receptor (open) NMDAreceptor(closed) StoredAMPAreceptor POSTSYNAPTICNEURON (a) Synapse prior to long-term potentiation (LTP) Figure 49.20 (b) Establishing LTP Actionpotential Depolarization (c) Synapse exhibiting LTP
PRESYNAPTICNEURON Ca2 Na Figure 49.20a Mg2 Glutamate NMDAreceptor(closed) NMDA receptor (open) StoredAMPAreceptor POSTSYNAPTICNEURON (a) Synapse prior to long-term potentiation (LTP)
1 2 3 Figure 49.20b Mg2 NMDA receptor AMPAreceptor Na Ca2 (b) Establishing LTP
1 3 4 2 Figure 49.20c NMDA receptor AMPAreceptor Actionpotential Depolarization (c) Synapse exhibiting LTP
50 Genes shared with relatives ofperson with schizophrenia 12.5% (3rd-degree relative) 40 25% (2nd-degree relative) 50% (1st-degree relative) 100% 30 Figure 49.22 Risk of developing schizophrenia (%) 20 10 0 Child Parent Fraternaltwin Identicaltwin Individual,generalpopulation Nephew/niece Uncle/aunt Full sibling Grandchild Half sibling First cousin Relationship to person with schizophrenia
Nicotinestimulatesdopamine-releasingVTA neuron. Inhibitory neuron Figure 49.23 Opium and heroindecrease activityof inhibitoryneuron. Dopamine-releasingVTA neuron Cocaine andamphetaminesblock removalof dopaminefrom synapticcleft. Cerebralneuron ofrewardpathway Rewardsystemresponse
Brain Figure 49.UN02 Spinalcord(dorsalnervecord) Sensoryganglia Nerve net Salamander (vertebrate) Hydra (cnidarian)
CNS PNS VENTRICLE Astrocyte Ependy-malcell Oligodendrocyte Figure 49.UN03 Cilia Schwanncells Capillary Neuron Microglial cell
Cerebralcortex Figure 49.UN04 Cerebrum Thalamus Forebrain Hypothalamus Pituitary gland Midbrain Pons Spinalcord Medullaoblongata Hindbrain Cerebellum