Download
1 / 39
390 likes | 407 Vues
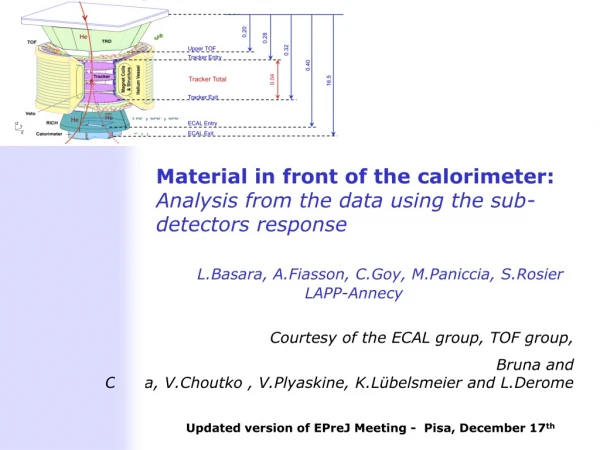
Material in front of the calorimeter: Analysis from the data using the sub-detectors response L.Basara , A.Fiasson , C.Goy , M.Paniccia , S.Rosier LAPP -Annecy. Courtesy of the ECAL group, TOF group,

E N D
Material in front of the calorimeter:Analysis from the data using the sub-detectors response L.Basara, A.Fiasson, C.Goy, M.Paniccia, S.Rosier LAPP-Annecy Courtesy of the ECAL group, TOF group, Bruna and Cecilia, V.Choutko , V.Plyaskine, K.Lübelsmeier and L.Derome Updated version of EPreJ Meeting - Pisa, December 17th Wouter Verkerke, NIKHEF
Outline • ECAL longitudinal profile – Longitudinal Delta Z measurement on MC events (el 128 GeV) Focusing on DATA (TB 120 GeV) MC comparison (el 128 GeV) • Electron/MIP Signature comparison in the : • ToF counters • Upper part • Lower part • RICH • Hit multiplicity in the Rich • “ but the hit used in the ring • Tracker • Inner and auter layers • Correlations • ToF/Rich ToF/Ecal Rich/Tracker(#9) Rich/Ecal Tracker(#9)/Ecal
Principle • Fit the Longitudinal profile and determine the maximum of the shower Gamma function • by adding material in front of thEcal, the shower will start earlier • As showed in previous presentations (S.Rosier AMS meeting Nov 11th, ECAL meeting 17th ) • Reference data TestBeam 2007 • ECAL alone (Plus Tracker layers 2 ? ) • EcaL with 2mm of Lead in front, equivalent to 0.4 X0 (what was supposed to be in front of the Ecal with the SC Magnet) • Ref papers • C.GoyCalor 2008 The AMS-02 3D-imaging calorimeter: A tool for cosmic rays in space. J.Phys.Conf.Ser.160:012041,2009 • C.Goy and S.Rosieret al. AMSNote 2008-07-01
Selection – First step • Data sample • ISS B538 (all data processed but a fraction will be shown(ie last 2 months) • Test Beam B538, ele180 • Electrons • Vertical particles (spanx<1 and spany<1) • Rely on TRD : TRD Likelihood [0.1-0.5] (old version) • based on Vitaly’s selection for EM (elec)-> Will use the Melanie’s tools • 1 EM shower, 1 track, 1 TRD track • Tracker “Good“ track • Negative charge , Pmom< -1 GeV/c • Spatial Matching between the track and the shower and the track and the TRD track • Ecal selection based on lateral variables ( S3/S5 x,y, Lateral dispersion, etc)
ISS data comparison with TB data 2007 • ISS B538 9-11 GeV (4 last months) • TB 2007 Data @ 10 GeV An overall shift of the shower is observed (max and in the first layers)
ISS data @ 10 GeV – Fit • ISS data @ 10 GeV max at 6.13 ± 0.03 (stat) ± syst (0.1) Layer Unit • TB 2007 @10 GeV 7.00 ± 0.03 ±(0.1) Layer unit
TB data @ 180 GeV August – Fit • TB 2010 @ 180 GeV max at 9.33 ± 0.05 (stat) ±syst (tbd) Layer Unit • TB 2007 @180 GeV 10.00 ± 0.04 ± (0.1) Layer unit
ΔX0 from Delta Z (MC el 128) MC electron 128 • Longitudinal Profile fit performed event by event, comparing the maximum of the longitudinal profile to the reference number as measured in 2007 (TB)* • Compared to previous presentations (11th Nov, 17th Nov, 24th , reweighted from the incidence angle à MC ΔZ= 0.54 ±0.05(stat) ± 0.08(syst) (X0unit) Data TB ΔZ= 0.75 ±0.05(stat) ± 0.08(syst)(X0unit) * Ref - S.Rosier et al, 11th , 17th , 24Th November AMS meetings - Cecilia and Bruna B. and her team has performed the measurement (fitting event by event and found ~0.6 X0, using x0=1.07 Layer unit, different reference number,different pre selection …) ΔZ(MPV)= 0.54 (X0unit) <ΔZ0> = 0.45 (X0unit) ΔZ (X0unit)
Outline • ECAL longitudinal profile – Longitudinal Delta Z measurement on MC events (el 128 GeV) Focusing on DATA (TB 120 GeV) MC comparison (el 128 GeV) • Electron/MIP Signature comparison in the : • ToF counters • Upper part • Lower part • RICH • Hit multiplicity in the Rich • “ but the hit used in the ring • Tracker • Inner and auter layers • Correlations • ToF/Rich ToF/Ecal Rich/Tracker(#9) Rich/Ecal Tracker(#9)/Ecal
Selection • Data sample • Test Beam B538 el120, MC el128 , MCpr400 GeV • MIP • Using ECAL (loose selection S3/S5 >0.98) • Abs(Z)==1 • Energy< 1 geV • TrdLoglikh>0.7 • Electrons • Rely on TRD : TRD Likelihood [0.1-0.5] • based on Vitaly’s selection for EM (elec) • 1 EM shower, 1 track, 1 TRD track • Tracker “Good“ track • Negative charge , Pmom< -1 GeV/c • Spatial Matching between the track and the shower and the track and the TRD track • Ecal selection based on lateral variables ( S3/S5 x,y, Lateral dispersion, etc)
Hit multiplicity in the Upper layers of the ToF Similar behaviour on X and Y views
UPPER TOF-layer 2 Comparing MIP and Electron signal in the Upper ToF MC electron 128 GeV TB electron 120 GeV Measuring the interaction rate in front of the second upper TOF Layer (fraction of events with N_cluster > 1) -> relatively well modeled (slightly more material in Data wrt MC)
Time measurement (red data 120 GeV) (blue MC 128 GeV) Wouter Verkerke, NIKHEF
Time measurement (red data 1317-10 GeV) (blue (MC 0512 <10 GeV)
Hit multiplicity in the Lower part of the ToF Similar behavior on X and Y views – more interactions wrt Upper ToF
UPPER TOF-layer 4 Comparing MIP and Electron signal in the Lower ToF MC electron 128 GeV TB electron 120 GeV Measuring the interaction rate in front of the second lower TOF Layer (interacting part if Nclusters>2 ) Trend : more material in data than in MC
Energy in the Lower part of the ToF Similar behavior on X and Y views and more interactions wrt the upper tof ToF group is measuring this more accurately
Multiplicity in the Rich Comparing MIP and Electron signal in the Rich MC electron 128 GeV TB electron 120 GeV Measuring the interaction rate in front of the Rich. (Interacting part if Nhit>=10) Trend more material in data than in MC
Rich – Removing hits used in the ring Comparing MIP and Electron signal in Rich MC electron 128 GeV TB electron 120 GeV Comparing MIP on data and MC Measuring the interaction rate in front of the Rich Trend-> more material in data than in MC
Tracker – TB120 GeV – Y view Deposit Energy in each layer using the hits and cluster belonging only to the track Efficiency : 100% layer 2, 85-90 % for the others(1,3,4,5,9) but the layer # 8 < 50 % Ask for at least one cluster in the layer
Tracker – TB120 GeV • Layer #8 : Different behaviour for layer # 8 wrt the rest (lower rate of events with a cluster) • Layer #9 : Tail - More signal compared to the other layers Similar and slightly more pronounced on X side
Tracker – TB120 GeV – Y view • Layer #8 : Different behaviour for layer # 7 wrt the rest (lower rate of events with a cluster) • Layer #9 : Tail - More signal compared to the other layers
Tracker – MC128 GeV • Layer #8 : Different behaviour for layer # 7 wrt the rest (lower rate of events with a cluster) • Layer #9 : Similar to other layers (#1,..) • All the maximum roughly at the same location
TB120GeV – MC128 GeV- Layer 2 Measuring the interaction rate in front of the first inner Tracker layer (Upper Tof+ TRD +laye #1) -> slightly more material in data than in MC
TB120GeV – MC128 GeV- Layer 6 Measuring the interaction rate in front of the sixth inner Tracker layer -> discrepancy Data/MC increases wrt to the first inner tracker layer
TB120GeV – MC128 GeV- Layer 9 Measuring the interaction rate in front of the Tracker layer #9 -> discrepancy Data/MC increased wrt to the other layers
Correlation RICH-ECAL - Longitudinal profile - The shower maximum is more shifted for higher hit multiplicity in the Rich - Impact of the selection on this DelatZ shift
Correlation RICH-ECAL Lateral dispersion Layer 1 Layer 2 The lateral dispersion is increasing with the hit multiplicity in the Rich If different on the MC, could explain Data/MC differences cf A.Fiasson (September 11) or S.Difalco (November 11th)
Correlation TOF-ECAL Longitudinal profile ToF layer #4 The longitudinal profile shift is increasing with the hit multiplicity in the ToF
Deposit Energy in the Tracker % ToF Tracker Layer#9 Y View Compared to ToF Layer#4 Tracker Layer#9 Y View Compared to ToF Layer#3 Tracker Layer#9 X View Compared to ToF Layer#4 !! Tracker – TOF spatial correlation !!
Summary • Applying the longitudinal profile method on Monte Carlo events (B512) ΔZ= 0.54 ±0.05(stat) ± 0.08(syst) x0 units in agreement with what was expected (V.C, M.I) on going : measurement on the average profile and measurements at different energies • A relative good agreement between data and MC is observed on the upper part of AMS, less true on the lower part • Correlations between ToF/Rich/Ecal and Tracker • Impact on the shower development the ECAL on both lateral and longitudinal variables and effect on this pre-showering on the E measurement. • Impact on e+/- identification an excess >.15 x0 is seen in TOF3, TOF4,RICH and ECAL )
Interaction probability- > Dx0 an excess >.15 x0 is seen in TOF3, TOF4,RICH and ECAL, *errors on those numbers are ongoing, contribution of backsplash also to be estimated)