Winning in the Long Run: A Quantified Approach to Uncertainty in Sustainable Financial Value in Real Estate
This working paper investigates how sustainability factors influence property returns and the associated risks, particularly in the context of low-growth economies. It aims to develop a comprehensive understanding of sustainability indicators and their impact on financial value in real estate. By decomposing existing rating systems and creating a mathematical model, this study seeks to inform investment decision-making in the real estate sector. The findings will offer insights into market responses and assist investors in navigating sustainability challenges.

Winning in the Long Run: A Quantified Approach to Uncertainty in Sustainable Financial Value in Real Estate
E N D
Presentation Transcript
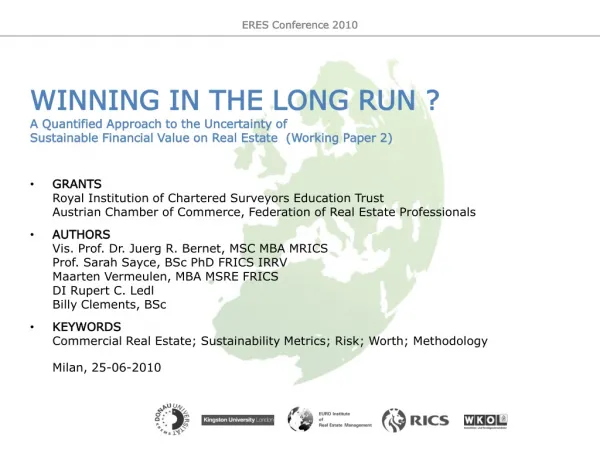
WINNING IN THE LONG RUN ? A Quantified Approach to the Uncertainty of Sustainable Financial Value on Real Estate (Working Paper 2) GRANTSRoyal Institution of Chartered Surveyors Education TrustAustrian Chamber of Commerce, Federation of Real Estate Professionals AUTHORSVis. Prof. Dr. Juerg R. Bernet, MSC MBA MRICSProf. Sarah Sayce, BSc PhD FRICS IRRVMaarten Vermeulen, MBA MSRE FRICSDI Rupert C. LedlBilly Clements, BSc KEYWORDSCommercial Real Estate; Sustainability Metrics; Risk; Worth; Methodology Milan, 25-06-2010
AGENDA RATIONALE: background – issues – aims CHALLENGE of a low growth economy BENEFITS of a sustainable performance plan CONCEPT of the driving systainability indicators FRAMEWORK of systainability metrics DATA SET for sustainability reporting MODEL for measuring the Impact of sustainability UNIVERSE of a first study in Europe WAY FORWARD searching market evidence
Project Rationale: BACKGROUND THEORY Environmental and social footprint – ongoing risk to property portfoliosLink through to value line via various conduits
Project Rationale: BACKGROUND REALITY Paucity of evidence to support value differential (Sayce et al, 2010)Limited evidence emerging in US – CERTIFICATION LEVEL No such evidence for European markets and portfolios KEY QUESTIONS What sustainability factors impact on property returns?What risks do they present?Are these risks priced appropriately?
Project Rationale: KEY ISSUES DEFINING SUSTAINABILITY No globally accepted definition or criteria setExisting empirical studies tie to CERTIFICATION as a surrogate (e.g. LEED) BUT Not necessarily an indication of ‘full’ or ongoing sustainabilityAccreditation uptake in Europe is limitedGrading and specific CRITERIA not extrapolated (w/exception of Energy Star) Identify aspects of commonality amongst existing rating systems/tools
Project Rationale: KEY ISSUES MEASURING SUSTAINABILITY Data measurement and collection core to building sustainability CRITERIA into financial modelling and worth forecasts BUT Measurement practices globally remain limitedKey metrics (e.g. Energy) only collected by 19% of investors (Kok et al. 2010) Identify those metrics which are most commonly collected and held by portfolio managers
Project Rationale: AIMS OVERARCHING AIM Develop a deeper understanding of how individual sustainability risks are translating into market responses to inform investment decision making OBJECTIVES [1] To decompose existing rating systems to establish in particular which characteristics are most widely included [2] To establish which sustainability characteristics are most likely to have an impact on risk/return performance moving forward [3] To set up a mathematical model capable of analysing risk and returns on assets against a selected range of sustainability and conventional performance characteristics [4] To trial the model on actual assets to test whether data can in practice be collated
The Challenge of a Low Growth Economy IN OUT Income Growth Non-RecoverableCost REDUCE ! Capital Expenditure Property Tax RATE OF RETURN (Inflation) ? PRESERVE ! Performance Attribution Income Yield
The Benefits of a Sustainable Performance Plan Standing Investment SHORT POSITION Performance Drivers Income Yield Income Growth Non-Recoverable Cost Capital Expenditure Property Tax - PERFORMANCE PLAN Sustainable Investment LONG POSITION Observations Expectations
The Concept of Driving Sustainability Indicators natural social economic PROPERTY • MANAGEMENT • ENVIRONMENT
Towards a Framework of SustainabilityMetrics REGULATORSEC (EPBD; GBP), ISO, CEN (EN15643-4) INVESTORSISA (BREEAM), GRA (GR), GBA (GBA-CM) COUNCILSUNEP-FI/SBCI (FSMR), GRI (CRESS), WGBC, SBA (CMF) SIRE AUDITORSKPMG, PWC, VERITAS,FERI ASSOCIATIONSRICS, ICSC (BREEAM), INREV, EPRA ASSESSORSBRE (BREEAM), GBCI (LEED), DGNB (DGNB), BMVBS (BNB), AHQE (HQE) CONSULTANTSJLL (OSCAR), IPD (ISPI), CBRE UNIVERSITIESKU (SAP), TUK, UM, HBS, CCRS (ESI), DUK
The Data Set for Sustainability Reporting PROPERTY ENVIRONMENT MANAGEMENT Natural Physical Natural Social Economic Strategic Financial Asset ISSUE ACCOUNT UNIT AMOUNT Energy Electricity kWh Fuels kWh Water used m3 Water Water recycled / harvested m3 Waste Waste disposed to landfill t Source: GBA (Ellison & Brown 2010) Waste disposed to other t Carbon Green house gas emissions t CO2e Emissions saved t CO2e
A Model for Measuring the Impact of Sustainability SUSTAINABILITYINDICATORS Explaning Variables PROPERTY ENVIRONMENT economic social natural MANAGEMENT PERFORMANCE DRIVERS Explained Variables (Income Yield) INCOME GROWTH NON-RECOVERABLE COST CAPITAL EXPENDITURE (Property Tax) ANALYTICALMODEL Mathematical Functions DCFDisconted Cash-Flow MFRMulti-Factor Regression ROAReal Option Analysis
The Universe of a First Studyin Europe INVESTMENT FUNDS POLICY, LEADERSHIP Investors North Europe GB S FS NL F DE CH A CZ Regions Office & Retail Single-Let, Multi-Let Sectors RESEARCH PORTFOLIO Cycle Standing, Retro-Fit In-USE Scope MANAGERS, (USERS) Ownership Pool-Size F/COUNTRY ≥ 2, F/POOL ≤ 25% 200-300 ASSETS
The Way Forward Searching for Market Evidence 5) SPECIFY APPROACHdescribemethodologyforanalysis of othermarkets 4) TEST LIMITATIONSverifygereralisation and restrictions andforfurtherresearch 3) FIND EVIDENCEevaluateobservations of sustainablilityworth 2) DESIGN MODELevaluatetheavailabledatawithalternative modelsettings 1) COLLECT DATAstructurethedatabaseandset up thedatatemplate
ACKNOWLEDMENTS . Royal Institution of Chartered Surveyors RICS Education Trust Austrian Chamber of Commerce, Federation of Real Estate Professionals Milan, 21-06-2010 Acknowledgements