Download

1 / 47
470 likes | 682 Vues
Part 2:. The Long Run. Chapter 3. An Overview of Long-Run Economic Growth. Charles I. Jones. 3.1 Introduction. In this chapter, we learn: some facts related to economic growth that later chapters will seek to explain.

E N D
Part 2: The Long Run
Chapter 3 An Overview of Long-Run Economic Growth Charles I. Jones
3.1 Introduction • In this chapter, we learn: • some facts related to economic growth that later chapters will seek to explain. • how economic growth has dramatically improved welfare around the world. • this growth is actually a relatively recent phenomenon.
3.1 Introduction • In this chapter, we learn: • some tools used to study economic growth, including how to calculate growth rates • why a “ratio scale” makes plots of per capita GDP easier to understand.
The United States of a century ago could be mistaken for Kenya or Bangladesh today. Some countries have seen rapid economic growth and improvements to health quality, but many others have not.
3.2 Growth over the Very Long Run • Sustained increases in standards of living are a recent phenomenon. • Sustained economic growth emerges in different places at different times. • Thus, per capita GDP differs remarkably around the world.
The Great Divergence The recent era of increased difference in standards of living across countries. Before 1700 Per capita GPD in nations differed only by a factor of two or three Today Per capita GPD in differs by a factor of 50 for several countries.
3.3 Modern Economic Growth • Timeline: From 1870 to 2000, United States per capita GDP… • rose by nearly 15-fold • Implications for you? • A typical college student today will earn a lifetime income about twice his or her parents.
The Definition of Economic Growth • Growth of per capita GDP • The exact rate of change of per capital GDP. • A percentage change • The change between two periods divided by the value of the variable in the initial period. • Percentage change in GDP between period t and and t + 1 “new” GPD “old” GPD
Percentage change between period t and and t + 1 Finding the growth rate between that same period Growth Rate
A Population Growth Example • Population (L below) also works this way. • Intuitively, tomorrow’s population in time period t + 1 depends on today’s population in period t
The constant growth rule: Initial variable value in period 0 Variable value in period t Constant Growth Rate Time Period
The Rule of 70 and the Ratio Scale • The Rule of 70 • If y grows at a rate of g percent per year, then the number of years it takes y to double is approximately equal to 70/g. • Notes • Small differences in growth rates result in large differences over time. • The time it takes to double only depends on the growth rate and not the initial value.
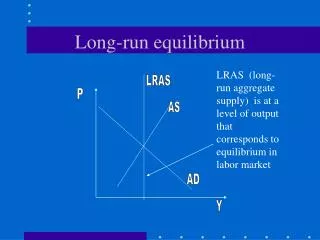
A ratio scale Plot where equally spaced tick marks on the vertical axis are labeled consecutively with numbers that exhibit a constant ratio When plotted on a ratio scale, a variable that grows at a constant rate will be a straight line.
U.S. GDP on a Ratio Scale • If a variable is growing at a constant rate it will be a straight line on a ratio scale • If growth rates are rising, the slope will be increasing.
U.S. GDP on a Ratio Scale • Per capita GDP in the United States has grown at approximately 2 percent per year over the last 130 years. • Easy to see with a ratio scale • Approximately linear
Calculating Growth Rates • The rule for computing growth rates • This formula can be applied even if the data does not exhibit constant growth. Solve for growth rate
3.4 Modern Growth around the World • After World War II, growth in Germany and Japan accelerated. • Convergence • Poorer countries will grow faster to “catch up” to the level of income in richer countries. • Brazil had accelerated growth until 1980 and then stagnated • China and India have had the reverse pattern.
A Broad Sample of Countries • Over the period 1960 – 2007 • Some countries have exhibited a negative growth rate • Other countries have sustained nearly 6 percent growth • Most countries have sustained about 2 percent growth. • Small differences in growth rates result in large differences in standards of living.
Case Study: People versus Countries • Since 1960: • The bulk of the world’s population is substantially richer • The fraction of people living in poverty has fallen • A major reason for changes • Economic growth in China and India • 40 percent of the world population!
3.5 Some Useful Properties of Growth Rates • Growth rates of ratios, products, and powers follow several simple rules. • Growth rates obey mathematical operations that are a level simpler than the operation on the original variable. • Variables Divided Growth Rates subtracted • Variables Multiplied Growth Rates added • Variable taken to a Power number Growth rate multiplied by that number
Suppose two variables x and y have average annual growth rates of gx and gy, respectively. Assume also that gz is the average annual growth rate of z Then the following rules apply:
Case Study: Growth Rules in a Famous Example, Yt= AtKt1/3Lt2/3 • Applying rules of growth rates • Original output equation: • Use multiplication rule to get • Use exponent rule to get
3.6 The Costs of Economic Growth • The benefits of economic growth • Improvements in health • Higher incomes • Increase in the variety of goods and services
Costs of economic growth include • Environmental problems • Income inequality across and within countries • Loss of certain types of jobs • Economists generally have a consensus that the benefits of economic growth outweigh the costs.
3.7 A Long-Run Roadmap • Are there certain policies that will allow a country to grow faster? • If not, what about a country’s “nature” makes it grow at a slower rate?
Summary • Sustained growth in standards of living is a very recent phenomenon. • If the 130,000 years of human history were warped and collapsed into a single year, modern economic growth would have begun only at sunrise on the last day of the year.
Summary • Modern economic growth has taken hold in different places at different times. • Since several hundred years ago, when standards of living across countries varied by no more than a factor of 2 or 3, there has been a “Great Divergence.” • Standards of living across countries today vary by more than a factor of 60.
Since 1870 growth in per capita GDP has averaged about 2 percent per year in the United States. per capita GDP has risen from about $2,500 to more than $37,000 Growth rates throughout the world since 1960 show substantial variation Negative growth in many poor countries Rates as high as 6 percent per year in several newly industrializing countries, most of which are in Asia.
Growth rates typically change over time. In Germany and Japan Growth picked up considerably after World War II Incomes converged to levels in the United Kingdom. Growth rates have slowed down as this convergence occurred.
Brazil exhibited rapid growth in the 1950s and 1960s and slow growth in the 1980s and 1990s. China showed the opposite pattern.
Economic growth, especially in India and China, has dramatically reduced poverty in the world. In 1960 2 out of 3 people in the world lived on less than $5 per day (in today’s prices). By 2000 this number had fallen to only 1 in 10.
This concludes the Lecture Slide Set for Chapter 3 Macroeconomics Second Edition by Charles I. Jones W. W. Norton & Company Independent Publishers Since 1923