Long-Run Costs*
110 likes | 337 Vues
Long-Run Costs*. IB-HL Economics Mr. Messere – BBB 4M7 Victoria Park C.I. *This is for all the lazy IB-HL students who are late &/or too exasperated to take notes in class. I should get paid extra $$$ for this eh? Enjoy!. Long-Run Average Cost.

Long-Run Costs*
E N D
Presentation Transcript
Long-Run Costs* IB-HL Economics Mr. Messere – BBB 4M7 Victoria Park C.I. *This is for all the lazy IB-HL students who are late &/or too exasperated to take notes in class. I should get paid extra $$$ for this eh? Enjoy!
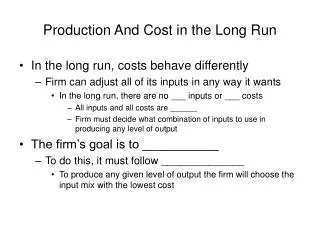
Long-Run Average Cost • Long-run average cost refers to the minimum short-run average cost at each possible level of output • The firm will choose the plant size that minimizes cost for any desired output level • The firm’s LRAC is tangent to the infinite number of short-run average cost curves – for this reason the LRAC curve is sometimes called the envelope curve
LRAC and Returns to Scale Three possible results: • Increasing returns to scale (Range A) • Constant returns to scale (Range B) • Decreasing Returns to scale (Range C)
LRAC and Returns to Scale • Increasing Returns to Scale / Economies of Scale (falls in the initial output Range A between AC1 and AC2) – situation in which a percentage increase in all inputs causes a larger percentage increase in output (eg. assembly-line manufacturing); caused by: • Specialization of labour • Specialized capital • Specialized management
LRAC and Returns to Scale • Constant Returns to Scale (occurs in Range B between AC2 and AC3)– situation in which a percentage increase in all inputs results in an equal percentage increase in output (eg. craft industries, manufacturing) • Decreasing Returns to Scale (occurs in range C beyond AC3) – situation in which a percentage increase in all inputs leads to a smaller percentage decrease in output (eg. primary industries); caused by: • management difficulties • limited natural resources
Minimum Efficient Scale (MES) • (MES) is the output for a business in the long run where the internal economies of scale have been fully exploited. • It corresponds to the lowest point on the long run average total cost curve (aka ‘output of long run productive efficiency’) • MES is rarely a single output - more likely it is a range of output levels where average cost is minimized where the firm achieves constant returns to scale. • MES varies from industry to industry depending on the nature of the cost structure in a particular sector of the economy.
Minimum Efficient Scale (MES) (MES) is useful in determining the likely market structure of a market. i.e. if minimum efficient scale small relative to the overall size of the market (demand for the good), there will be a large number of firms as in perfect competition Practice