Download
1 / 57
570 likes | 714 Vues
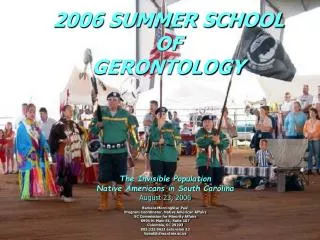
2006 SUMMER SCHOOL OF GERONTOLOGY. The Invisible Population Native Americans in South Carolina August 23, 2006 Barbara MorningStar Paul Program Coordinator, Native American Affairs SC Commission for Minority Affairs 6904 N. Main St., Suite 107 Columbia, SC 29203

E N D
2006 SUMMER SCHOOL OF GERONTOLOGY The Invisible Population Native Americans in South Carolina August 23, 2006 Barbara MorningStar Paul Program Coordinator, Native American Affairs SC Commission for Minority Affairs 6904 N. Main St., Suite 107 Columbia, SC 29203 803.333.9621 extension 23 bpaul@cfma.state.sc.us
WHAT ARE THE MAJOR ISSUES TODAY? • How to Relate to Native people • Cultural differences • Addiction issues • Physical Health/Mental Health Issues • Criminal Justice issues • Family structure • Indian Child Welfare Act • Spiritual beliefs • SERIOUS Lack of Accurate Statistics in South Carolina • Barriers to Treatment
MORE ISSUES TO CONSIDER • Education/Literacy • Healthcare • Economic Status • Poverty Rates • Addiction to Alcohol and Other Drugs • Criminal Justice – Adult and Juvenile… • Crimes Against Women/Domestic Violence • Family Structure • Infant Mortality
Overview of Native American Population • Federal vs. State Recognition – What it means….. • The Native American Population is growing at a rapid pace • Current Native American population in South Carolina: • Claiming Native American race only – 13,718 • Claiming Native American and another race – 27,623 • Of those: • 1,441 claim Native American of Hispanic descent as one race only • 2,107 claim Native American of Hispanic descent as more than once race
A BRIEF HISTORY LESSON • First contacts between Europeans and Indians in South Carolina. • Colonization • Treaties • The Trail of Tears (Indian Removal Act) • What did it do?? "Even the seasons form a great circle in their changing, and always come back again to where they were. The life of a man is a circle from childhood to childhood and so it is everything where power moves." --Black Elk (Hehaka sapa), OGLALA SIOUX
MORE HISTORY… • In all, Southeastern Indians (not just Cherokee) gave up about 100 million acres of land for about 32 million acres in West • Indian Appropriations Act of 1871 • The General Allotment Act in 1887 • How did all of this affect Indian health??
PERCEPTIONS BY OTHERS • Pan-Indianism • Heathenism • Presence or lack of presence in the State – “NATIVE AMERICANS DO NOT REPORT THEIR RACE ACCURATELY” • REASONS FOR NOT REPORTING RACE AS NATIVE AMERICAN • MISCEGENATION LAWS • CENSUS • TRAIL OF TEARS • PREJUDICE/REPRISAL PRE AND POST CIVIL WAR/SEGREGATION SOUTH • CIVIL RIGHTS??? FOR WHO??? • RELIGIOUS FREEDOM ISSUES • FEAR, FEAR, FEAR • How they look….. • Stereotypes • INACCURACIES ARE DOCUMENTED AND OBVIOUS
SO WHAT?? WHY ARE YOU TELLING US ALL THIS? IS THERE A CONNECTION BETWEEN SELF IMAGE/SELF RESPECT AND: • MENTAL HEALTH • PHYSICAL HEALTH • BEHAVIORS – HEALTHY AND UNHEALTHY IS THERE A CONNECTION BETWEEN POVERTY/ILLITERACY AND: • MENTAL HEALTH • PHYSICAL HEALTH • BEHAVIORS – HEALTHY AND UNHEALTHY
NATIVE AMERICANS IN SOUTH CAROLINA • How many tribes and groups are in South Carolina? • “First Contact” • Archaeology • “Invisible” • Statistics. • Are seriously underserved.
3 11 24 13 2020 15 2 LEGEND STATE RECOGNIZED TRIBES 1. Waccamaw Indian People 2. Pee Dee Indian Nation of Upper SC 8. Beaver Creek Indians 9.. Santee Indian Organization 15.Pee Dee Indian Tribe of South Carolina FEDERALLY RECOGNIZED TRIBES 3. Catawba Indian Nation RECOGNIZED GROUPS 4. Wassamasaw Tribe of Varnertown Indians 5. Eastern Cherokee, Southern Iroquois and Unite Tribes of SC 7. Chaloklowa Chickasaw Indian People of SC RECOGNIZED SPECIAL INTEREST ORGANIZATIONS 19.American Indian Chamber of Commerce of SC UNRECOGNIZED TRIBES/GROUPS 6. Chicora Indian Tribe of South Carolina 10.Pee Dee Indian Nation of Beaver Creek 11.Santee Indian Nation 12.Natchez Indian Tribe 13.Piedmont American Indian Association; Lower Eastern Cherokee 14.Edisto Tribe 16.Croatan Indian Tribe of SC 17.Horse Creek American Indian Heritage Association 18.Fields Indian Family-Pine Hill Indian Community 20.Marlboro county/Chesterfield County Pee DeeTribe 21.The American Indian Center of SC 22.Midlands Intertribal Empowerment Group 23.Carolina Indian Heritage Association 24.Cherokee Bear Clan of South Carolina 25. Sumter Band of Cheraw Indians **Compiled by Barbara MorningStar Paul Program Coordinator, Native American Affairs State of South Carolina Commission for Minority Affairs Columbia, South Carolina 6-21-06 12 1 21 22 25 6 10 5 8 16 7 23 18 17 9 14 4 19 For further information, please contact the S.C. Commission for Minority Affairs at: (803) 333-9621 NATIVE AMERICAN TRIBES AND GROUPS IN SOUTH CAROLINA
The good, the bad and the ugly….. • Smallpox • Alcoholism/Addiction • Lack of education • High drop out rates • Low economic and income levels • Miscommunications • Fears
So you think you can relate to Native People? • “My grandmother was a Cherokee princess……” • Exercise: "What you see with your eyes shut is what counts." --Lame Deer, LAKOTA • “The Santee Indians came together and built their won school. It was called Crane Pond School and it was an all-Indian school. This was set up by the government. We also weren’t allowed to mix with the white people. This took place back in the early 1900’s. I was only allowed to go to the seventh grade and only the whites and blacks could finish high school. We could not ride the bus or go into establishments. If we went to town for anything we had to go to the window and wait for whatever service was needed by the established. We were finally allowed to ride the bus but could only sit in the very back, quietly.” (Voncile Pratt-Platt Todd, August 25, 2005”). • Educational/Language Barriers • i.e. medical-speak • i.e. government speak • Literacy issue and sensitivity The Old Ones have always said that no matter who despises or ignores you, no matter who keeps you from entering their circles, it is right to pray for them because the are like us, too." --Larry P. Aitken, CHIPPEWA
Cultural Issues • Resentments and Why: • Euro-culture • African American Culture • Hispanic/Latino Culture • How to avoid triggering resentments
Addiction Issues • AI/ANs are the most impoverished of today’s minority groups. Over one quarter live in poverty, compared to 8 percent of whites.A heterogeneous grouping of more than 500 Federally recognized tribes, the AI/AN population experiences a range of health and mental health outcomes. • While AI/ANs are, on average, five times more likely to die of alcohol-related causes than are whites, they are less likely to die from cancer and heart disease. • According to the S.C. Budget and Control Board Office of Research and Statistics (9/19/2005), DAODAS reported serving ONLY 127 Native American people. • WHAT IS WRONG WITH THIS PICTURE??? • MENTAL HEALTH: A REPORT OF THE SURGEON GENERAL 1999
PHYSICAL HEALTH/MENTAL HEALTH • “…… more than half of the AI/AN population does not permanently reside on a reservation,3 and therefore have limited or no access to IHS services. Geographic isolation, economic factors, and suspicion toward traditional spiritual beliefs are some of the reasons why health among AI/ANs is poorer than other groups. Other factors that contribute to poorer health outcomes for AI/ANs include cultural barriers, geographic isolation, inadequate sewage disposal, and economic factors.4 “ • American Indians born today have a life expectancy 5 years less than non-Indians (NATIVE AMERICAN RESEARCH CENTERS FOR HEALTH Release Date: August 21, 2000) • HOW MANY FEDERALLY RECOGNIZED TRIBES ARE IN SOUTH CAROLINA????? • WHAT HAPPENS TO THE REST OF THEM??? 3Statistical Handbook on Racial Groups in the United States by T.B. Heaton, B.A. Chadwick, and C.K. Jacobson; Phoenix: Oryx Press, 2000; Table A3.5. 4 The Health Care Challenge: Acknowledging Disparity, Confronting Discrimination, and Ensuring Equality. United States Commission on Civil Rights, Sept. 1999. 5American Indian & Alaska Native (AI/AN) Populations;CDC; Office of Minority Health
PHYSICAL HEALTH/MENTAL HEALTH – Continued According to a 2001 study by the U.S. Department of Health and Human Services , among AI/AN youth aged 12 to 17 years in 1999-2000: • Illicit drug use was more than twice as high (22.2%) as the national average (9.7%). • Binge alcohol use was higher (13.8%) than the national average (10.3%). • Heavy alcohol use was higher (3.8%) than the national average (2.5%). • Driving under the influence of illicit drugs or alcohol in the past year was slightly lower (10%) than the national average (11.2%). • Use of cigarettes was more than twice as high (27.2%) as the national average (13.4%). • Getting into at least one serious fight at school or work in the past year was higher (22.1%) than the national average (19.9%). Source: Fact Sheet, Surgeon General’s Report; U.S. Department of Health and Human Services, Office of the Surgeon General, SAMHSA, 1999
PHYSICAL HEALTH/MENTAL HEALTH – Continued • Taking part in at least one group-against-group fight in the past year was higher (22.4%) than the national average (16.1%). • Carrying a handgun at least once in the past year was about the same (3.3%) as the national average (3.2%). • Data also indicate the presence of despair. • Suicide is the second leading cause of death for AI/AN youth in the 15-24 age group • The suicide rate is 2.5 times higher for AI/AN people than the combined rate for all races in the United States (USDHHS, 1999).
PHYSICAL HEALTH/MENTAL HEALTH – Continued • In the BIA study, 19% of AI/AN high school youth had seriously considered suicide during the preceding year. Although still a strong cause for concern, this statistic does represent an improvement over the 29% reported in the 1994 survey (Shaughnessy, Branum, & Everett-Jones, 2001). • Native males ages 15 to 24 account for two-thirds of all Native suicides. • Violent deaths – unintentional injuries, homicide, and suicide – account for 75% of all mortality in the second decade of life for AIANs. (Source: Fact Sheet, Surgeon General’s Report; U.S. Department of Health and Human Services, Office of the Surgeon General, SAMHSA, 1999.) • Homicide and legal intervention are the third leading cause of death for Indian youth (ages 15-24); the homicide rate among American Indians is 1.2 times that of the general U.S. population (USDHHS, 1999). Social and Emotional Distress Among American Indian and Alaska Native students: Research Findings by Ardy SixKiller Clarke; EDO-RC-01-11 (January 2002)
PHYSICAL HEALTH/MENTAL HEALTH – Continued AI/ANs are over-represented among high need populations: • People who are homeless. • People who are homeless. While representing less than 2% of the U.S. population, it is estimated that AI/ANs constitute 8% of Americans who are homeless. • People with alcohol and drug problems. • People who are incarcerated – see “Criminal Justice” slide • People who are victims of trauma – see “Criminal Justice” slide • “Need for Services: Research on AI/ANs is limited by the small size of this population and by its heterogeneity. “ MENTAL HEALTH: A REPORT OF THE SURGEON GENERAL 1999 *****"Silence is the absolute poise or balance of body, mind and spirit." --Charles A. Eastman (Ohiyesa), SANTEE SIOUX
AND MORE INFO…… • Access to Services:About 20 percent of AI/ANs do not have health insurance, compared to 14 percent of whites. • Traditional healing is used by a majority of AI/ANs. • Appropriateness and Outcomes of Services: The appropriateness and outcomes of mental health care for AI/ANs have yet to be examined, but are critical for planning treatment and prevention programs. MENTAL HEALTH: A REPORT OF THE SURGEON GENERAL 1999
SO DO INDIAN PEOPLE TRUST YOU?? A government prohibition on participation in traditional spiritual ceremonies continued until the American Indian Religious Freedom Act of (1978). • …….traditional cultural views still heavily influence the way in which Native people understand life, health, illness, and healing (Todd-Bazemore, 1999). • American Indian adolescents were much more likely to be diagnosed with AD/HD and substance abuse or substance dependence disorders. The rates of conduct disorder and oppositional defiant disorder were also elevated in the American Indian sample. • MENTAL HEALTH: A REPORT OF THE SURGEON GENERAL 1999 Everything's so simple, and we make everything so complicated. That's why we're confused." --Vickie Downey, TEWA/Tesuque Pueblo
Criminal Justice – Victimization;Crimes Against Women/Domestic Violence • People who are incarcerated. • People exposed to trauma. The rate of violent victimization of AI/ANs is more than twice the national average. • The higher rate of traumatic exposure results in a 22% rate of PTSD for AI/ANs, compared to 8% in the general U.S. population. • The American Indian Vietnam Veterans Project found lifetime prevalence of PTSD to be 45 to 57% among AI veterans, rates significantly higher than among other Vietnam veterans. Source: Fact Sheet, Surgeon General’s Report; U.S. Department of Health and Human Services, Office of the Surgeon General, SAMHSA, 1999 • Catawba Indians 1910
Criminal Justice and Incarceration THE FASTEST GROWING INDIAN RESERVATIONS??
Family Structure • American Indian families maintained by a single female increased between 1980 and 1990. However, the Native Americanincrease of27 percent was considerably larger than the national figure of 17 percent. * • High incidence of Indian households headed by women (45%), 42% of whom were younger than 20 when they had their first child (LaFromboise, Choney, James, & Running Wolf, 1995). • American Indian families were slightly larger than the average size of all U.S. families (3.6 versus 3.2 persons per family) (U.S. Census Bureau, 1993). * • ……..households in many American Indian communities exhibit much higher dependency indices than other segments of the U.S. population and are more comparable to impoverished Third World countries (Manson & Callaway, 1988). • Families continue to feel alienated from mainstream educational purposes and institutions, which reduces their involvement in their children's educations (Cummins, 1989). • * MENTAL HEALTH: A REPORT OF THE SURGEON GENERAL 1999 • "Even the seasons form a great circle in their changing, and always come back again to where they were. The life of a man is a circle from childhood to childhood and so it is everything where power moves." --Black Elk (Hehaka sapa), OGLALA SIOUX
SPIRITUAL BELIEFS • Many Christian Native Americans, but with remnants of their own cultures infiltrated • Some Native Americans maintain spiritual practices from their ancestors • Smudging • Sweat lodges • Feathers…. • Pow wows and blessing of the circle
WHAT IS HAPPENING TO OUR CHILDREN? • Multiple studies have shown the adverse effects of chronic exposure to violence on a child's ability to learn • Many AI/AN youth live in communities that continue to experience long-term economic and social distress. High rates of alcoholism, drug abuse, domestic abuse, child neglect, substandard housing, and lack of job opportunities are common conditions in Indian communities. • "We know that in all creation/Only the human family/Has strayed from the Sacred Way." --OJIBWA Prayer
INDIAN CHILD WELFARE ACTAND WHAT DOES THAT HAVE TO DO WITH YOU? • MULTI-PURPOSE ACT • US Government recognizes that a disproportionate number of Native children have been removed from their homes and placed in white homes • Protects children from losing their culture • Prevents breakup of Native American families while protecting children from “In any adoptive placement of an Indian child under State law, a preference shall be given, in the absence of good cause to the contrary, to a placement with (1) a member of the child's extended family; (2) other members of the Indian child's tribe; or (3) other Indian families.”
SC American Indian Birth Data • In 2004, there were 328 births to Native American mothers in SC. • This represents less than 1% of total live births. • There were 5 infant deaths from 1999-2004. • The US infant mortality rate for 2002 was 8.6 deaths per 1,000 live births. Data Source: SC DHEC Vital Records Terri WhirrettLt. Governor’s Office on AgingPresented at the Native American ConferenceNovember 18, 2005 CURRENT SITUATION Most current statistics from IHS demonstrate: SIDS death rate declines 58% in IHS areas. Infant mortality rate in IHS areas 94-96 was 9.3 vs. US all races rate of 7.6 (22% higher) Aberdeen, Tucson, and Nashville areas exceeded US rate by over 50% Indian Healthcare Reauthorization Act R. Mona Rosenman DIRECTOR STRATEGIC COMMUNICATIONS & POLICY CJ Foundation For SIDS
LACK OF STATISTICS IN SOUTH CAROLINA • What DO we know? • According to SC Department of Education, in their 2004 “Quick Facts” publication, the drop out rate for American Indian/Alaskan children grades 9-12 was a staggering 6.3 – the HIGHEST in the State, followed by 3.8 for African American children. • Does lack of education help/hurt this population? • Older American Act (Aging Services) have been provided to only 31 Native Americans in the last year!
MORE THAT WE DO KNOW… “Diabetes has risen to epidemic proportions in some populations, and many others are fighting the battle against obesity and high blood pressure. Because native people generally earn less than the average American and tend to live in remote, rural locations, some may have limited access to clinical preventive services, health education, and prevention efforts. All these factors act synergistically to place native people at very high risk for chronic diseases.” (NIH Study 1998.)
heraldonline.com By Denyse C. Middleton · The Herald - Updated 08/21/06 - 12:40 AM “…But the elimination of federal grants for health care to the only federally recognized American Indian tribe in the state has resulted in transportation and medication problems at the reservation's health clinic. The clinic is operated by Indian Health Services and offers free health checks and generic medications to the elders, said tribal executive committee member Claude Ayers…..” Catawba master potter Evelyn George, 92, polishes a piece of pottery with a smooth stone to prepare it for firing Thursday at the Catawba Senior Center on the reservation. Andy Burriss · The Herald "Just about everyone down here on the reservation has heart trouble and diabetes," Plyler said. "We need someone to go out and check on the seniors at home. We need a home health service."
According to the 2000 Census, there were only 1,180 Native American Indians age 65+ in the entire state!Terri WhirrettLt. Governor’s Office on AgingPresented at the Native American ConferenceNovember 18, 2005
Census 2000 • “According to the 2000 census, the median age of 29 years for American Indians and Alaska Natives was about 6 years younger than the national median of 35 years”. • “Less than 10 per cent of all American Indian tribal groupings were 65 years of age and older”
American Indian Leading Causes of Death for US *Age adjusted to 2000 population
American Indian Leading Causes of Death for SC Terri WhirrettLt. Governor’s Office on AgingPresented at the Native American ConferenceNovember 18, 2005 Data Source: SC DHEC Vital Records Rate not available for SC
Aging Population PROGRAMS AND SERVICES AVAILABLE TO SENIORS IN S.C. • Information, Assistance, and Referral • Insurance Counseling • Legal Assistance Services • Living Will Witness Program • Long Term Care Ombudsman Program • Adult Day Services • Group Dining • Disease Prevention and Health Promotion • Elder Abuse Prevention • Employment Services • Homebound Support • Home Care Services • Home-Delivered Meals • Respite and Caregiver help • Terri WhirrettLt. Governor’s Office on AgingPresented at the Native American ConferenceNovember 18, 2005
availability of limited state and federal resources; therefore, the percentage of persons served declined Figure III.7.2.5 Source: US Census current population and National Aging Program Information System Federal Report Terri WhirrettLt. Governor’s Office on AgingPresented at the Native American ConferenceNovember 18, 2005
Native American Information Across Agencies and Systems for 2004 Service Entity Number of Native Americans Hospital 2,551 Inpatient 575 Outpatient 1, 351 Medicaid Inpatient 540 Outpatient 416 Terri WhirrettLt. Governor’s Office on AgingPresented at the Native American ConferenceNovember 18, 2005 • "It is well to be good to women in the strength of our manhood because we must sit under their hands at both ends of our lives." --He Dog, OGLALA LAKOTA
Office of Research and Statistics, State Budget and Control Board • DemographicNumberNative Indian/Alaska Native • Age: • 60-64 390 • 64-69 360 • 70-74 190 • 75-84 180 • 85+ 60 • Total 1,180 • Median Income: $30,568 Terri WhirrettLt. Governor’s Office on AgingPresented at the Native American ConferenceNovember 18, 2005
A Portrait of Older MinoritiesResearch ReportAARP Minority Affairs November 1995 “Indian Health Service figures for 1990 show average life expectancy at birth for Native Americans to be only 67 years, eight years less than that of whites. American Indians and Alaskan Natives are 10 times more likely to develop diabetes than whites. In addition, alcohol abuse is a leading cause of health problems including accidents, cirrhosis of the liver, suicide, and homicide. The other major health problems of older Native Americans are tuberculosis, liver and kidney disease, high blood pressure, pneumonia, and malnutrition. The majority of older Native Americans rarely see a physician, primarily because those needing medical assistance often live in isolated areas and lack transportation. Native American traditions of ritual folk healing and the spiritual aspect of disease have also deterred reliance on a strictly scientific medical community. These factors are often neglected or overlooked by health care professionals and planners.
A Portrait of Older MinoritiesResearch ReportAARP Minority Affairs November 1995(CONTINUED) “The status of the older minority members is not likely to improve greatly in the immediate future. The factors which largely determine their quality of life (education, employment, income, and health) will not vary much among the minority populations now approaching retirement age. “
Native American Information Across Agencies and Systems for 2004 Service Entity Number of Native Americans Hospital 2,551 Inpatient 575 Outpatient 1, 351 Medicaid Inpatient 540 Outpatient 416 Terri WhirrettLt. Governor’s Office on AgingPresented at the Native American ConferenceNovember 18, 2005
Native American and Alaskan Native alone or in combination with one or more other races • Age: • 60+ 2,834 • 65+ 1,983 • 75+ 783 • Median Income: $33,750 Terri WhirrettLt. Governor’s Office on AgingPresented at the Native American ConferenceNovember 18, 2005
AND MORE NUMBERS……. Service Entity Number of Native Am. DSS TANF 349 Foodstamps 2,438 Foster Care 15 Child Prot. Serv. 19 Dept. of Ed. 2,869 DAODAS 127 DMH 281 Total Undup. 8,113 Terri WhirrettLt. Governor’s Office on AgingPresented at the Native American ConferenceNovember 18, 2005
SO WHAT’S UP WITH THESE NUMBERS??? • Native American population demographic information is sketchy at best! • Aging service providers need to find better ways to reach out to older Native Americans. • There is a need for Native Americans to claim their heritage so that services can be made available to them. Terri WhirrettLt. Governor’s Office on AgingPresented at the Native American ConferenceNovember 18, 2005
Alternative Views within the Native American Population • Medicines • Use ancient remedies and spiritual methods • Disease • Diabetes • Heart Disease/Cardiovascular Disease • Cancer • Alcoholism/Addiction • DNA Typing • “Proof” of Indianness pro’s and con’s • History, genealogy • Understanding of culture • Reproduction • Spiritual/Religious beliefs