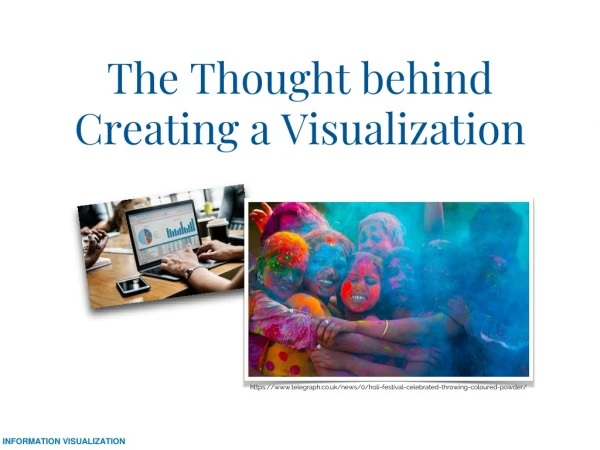
The Thought behind Creating a Visualization
Explore the strategic thinking behind creating impactful visualizations, examining elements such as data trends, aesthetics, and user engagement to craft compelling graphics. Learn about data-centric, user-centric, visual-centric, and communications-centric approaches to visualization design.

The Thought behind Creating a Visualization
E N D
Presentation Transcript
The Thought behind Creating a Visualization https://www.telegraph.co.uk/news/0/holi-festival-celebrated-throwing-coloured-powder/
“thinking” about visualizations • Thinking visually … our goal is to combine the components we’ve reviewed so far an balance them for the task, the audience, and the data: • Are the data univariate, bivariate, or multivariate? • Is there a trend in the data that suggest a design? For instance time-based data and bivariate data suggest chart with two axes, time on the x access, dimensions on the y axes. • But a history- or image-oriented one - suggests a richer visual-ladened chart. Compare …
Two charts of similar data, different orientations, and visual expressions https://www.thestatszone.com/the-growth-of-the-ufc-ahead-of-the-historic-ufc200
Same audience, task, and similar data … Compare these timelines of art https://www.theartstory.org/jewish_art.htm
A chart that, perhaps, has gone too far … Besides reducing or clustering the data, what other options http://ramakarl.com/imgs/page_artmap.png
InfoVis: Aesthetic elements Data Color, Type Composition
InfoVis: Univariate, Bivariate, Multivariate Data - what trend is being suggested by the data? Aesthetic elements Do the symbols harmonize with the data? Are aesthetic elements that contribute to the visual appeal overtaking legibility? Data Color, Type Composition Are the colors indexed to the data; suggest patterns, groups, differences? Does the choice of type support legibility, understanding scales and data values? Does the composition encourage engagement? Situate the user to interpret the data?
Check out these online guides about colors, their codes, and trends in color patterns Color-Oriented • Color Chart: Reinventing color – 1950 to today • Soothsayer of Color • Color Hunt • Palletton • ColourLovers • Design Seeds R (ggplot) Tableau Python with matplotlib, seaborne and other libraries Bokey Spreadsheet charts • Data-Oriented
Approaching design • Audience expectations • Types of interactivity with the end-user • Properties of the data • Domain or topic being studied • The task or purpose of the visualization • present | explain | explore | discover • Aesthetic design influences
Perspectives • long-term engagement with the visualization based on the aesthetic qualities; • understanding the interplay between the data that are the foundation and their graphic representation’s placement, color, and similarities/differences; • interacting with the two bullet points above to arrive at a conclusion, or some new knowledge; • helping a viewer take further action (i.e., make a person aware of the phenomenon, knowledgeable, and hence “being informed”); and • providing a rationale for conclusion so that the viewer can articulate the reasons for his/her decisions • Models of approaching how to integrate the whole … • Data-centric • emphasizes the charting of the data • User-centric • tends to underscore affective states, user engagement • Visual-centric • leads more towards imagery but can overwhelm the data (information graphics) • Communications-centric • balancing the above with user-interactivity to stimulate sustained questioning to arrive at warranted decisions
Case studies discussion Shayne Quincy Public Library Bonnie Bonnie