Download
1 / 18
180 likes | 339 Vues
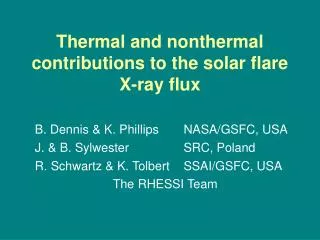
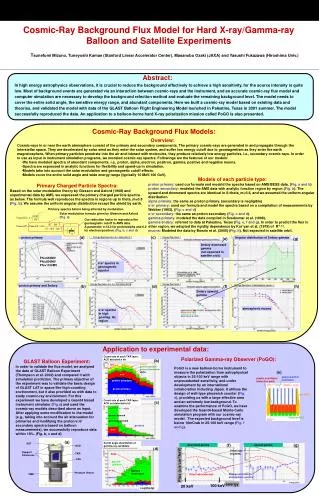
Thermal and Nonthermal Contributions to the Flare X-ray Flux. Brian R. Dennis 1 , Kenneth J. H. Phillips 1, 2 , Richard A. Schwartz 1, 3 , Anne K. Tolbert 1,3 , and Hugh S. Hudson 4 1 NASA GSFC, 2 NRC Senior Resident Research Associate 3 SSAI, 4 SSL Berkeley. Introduction.

E N D
Thermal and Nonthermal Contributions to theFlare X-ray Flux Brian R. Dennis1, Kenneth J. H. Phillips1, 2, Richard A. Schwartz1, 3, Anne K. Tolbert1,3, and Hugh S. Hudson4 1NASA GSFC, 2NRC Senior Resident Research Associate 3SSAI, 4SSL Berkeley
Introduction RHESSI provides high resolution imaging and spectroscopy X-ray observations in the critical energy range from a few keV to a few tens of keV. These observations allow the following classic ways to be used to differentiate between the thermal and nonthermal components of the X-ray flux: • gradually vs. impulsively varying flux • exponential vs. power-law spectra, • extended coronal vs. compact footpoint sources RHESSI also detects the iron-line complex at ~6.7 keV (1.9 Å). • The peak energy is a function of temperature. • The equivalent width (line-to-continuum ratio) is a function of temperature and iron abundance. Mewe (1985/6) and Chianti (1997) give line and continuum spectra as functions of temperature and abundances. These predictions are compared with RHESSI measurements for the X-flare on 21 April 2002. References Mewe, Gronenschild, van den Oord, 1985, (Paper V) A. & A. Suppl., 62, 197; Mewe, Lemen, and van den Oord, 1986, (Paper VI) A. & A. Suppl., 65, 511 Mewe, R., Kaastra, J. S., Liedahl, D. A., “Update of MEKA: MEKAL” (http://heasarc.gsfc.nasa.gov/docs/journal/meka6.html) Legacy, Journal of the High Energy Astrophysics Science Archive Research Center (HESARC), NASA GSFC, 6, 16, 1995. Dere, K. P.; Landi, E.; Mason, H. E.; Monsignori Fossi, B. C.; Young, P. R., “CHIANTI - an atomic database for emission lines” A & A Supplement series, 125, 149-173, 1997.
RHESSI Time History • Soft X-ray flux (<12 keV) rises gradually suggesting thermal emission. • Hard X-ray flux (>25 keV) shows impulsive peaks at ~01:16 UT suggesting nonthermal emission.
RHESSI ContoursWhite: 6 – 12 keVBrown: 12 – 25 keVBlue: 25 – 50 keV TRACE Image1.95 nm
RHESSI Imaging • Compact hard X-ray sources (>25 keV) on TRACE ribbons suggest nonthermal emission at loop footpoints. • Extended soft X-ray source (<25 keV) and diffuse TRACE emission in corona suggest thermal emission at ~20 MK.
RHESSI SpectraThin Shutters In (A1)Detector #41-minute accumulations
RHESSI SpectraThin Shutters (A1)Thin + Thick (A3)Detector #41-minute accumulations
RHESSI Spectra • Steep spectra before ~01:00 UT suggest thermal emission. • Flatter power-law spectrum above ~20 keV at 01:16 UT suggests nonthermal emission. • Peak at ~6.7 keV (1.9 Å) is the iron-line complex from thermal plasma. • Peak at ~8 keV is most probably the Fe/Ni complex. • Peak at ~10.5 keV is most probably caused by K-escape from the germanium detectors.
Peak Position of Iron-line Complex Energy in keV
A0 A1 A3 Iron-line ComplexRHESSI Measurements of Peak Energy
Iron-line Complex - Peak Energy • Detector-to-detector variations and higher-than-predicted peak energy must be instrument calibration issues. • Variation of peak energy with time may be related to high detector count rates. • Reason for sharp rise in peak energy determined from detector #8 after ~01:14 UT is unknown.
Equivalent Width of Iron-Line Complex Chianti (coronal abundances) Mewe_spec(coronal - Meyer 1985) Chianti (photospheric)
Iron-line Complex – Equivalent Width • Equivalent-width measurements should be relatively independent of detector energy calibration and sensitivity. • Detector-to-detector differences seem to be related to energy resolution. • Large differences exist between Mewe (1985/6) and Chianti (1997) predictions. • Measured equivalent widths are higher than predicted by both Mewe and Chianti, even for coronal abundances (Fe abundance 3 x photospheric).
Conclusions • RHESSI can differentiate between thermal and nonthermal emissions. • Iron-line features are clearly seen in RHESSI spectra. • Detector response is still preliminary – work in progress. • Mewe (1985/6) and Chianti (1997) models of the thermal spectra differ in the predicted line intensities. • GOES temperatures may be inaccurate since they are calculated using the older Mewe spectra.