Download
1 / 33
330 likes | 656 Vues
RHESSI and the Solar Flare X-ray Spectrum. Ken Phillips. Presentation at Wroclaw Workshop “ X-ray spectroscopy and plasma diagnostics from the RESIK, RHESSI and SPIRIT Instruments “, December 6—8, 2005. Reuven Ramaty High Energy Solar Spectroscopic Imager (RHESSI).

E N D
RHESSI and the Solar Flare X-ray Spectrum Ken Phillips Presentation at Wroclaw Workshop “X-ray spectroscopy and plasma diagnostics from the RESIK, RHESSI and SPIRIT Instruments “, December 6—8, 2005
Reuven Ramaty High Energy Solar Spectroscopic Imager (RHESSI)
RHESSI Launch from Pegasus Launch of RHESSI: Feb. 5, 2002 Pegasus rocket carrying RHESSI NASA plane
RHESSI Spacecraft Concept S/C Rotates SUN
RHESSI’s Energy Range • RHESSI observes soft and hard X-ray emission up to gamma-rays: 4 keV up to 17 MeV • Conversion is λ(Å) = 12.4 / E (keV)
RHESSI 10—25 keV images of near-limb flare LinHui Sui & Holman 2003 Solar Limb Spatial resolution in these images 7 arcsec (can be as good as 2 arcsec)
Holman et al. (2002) -- HXR and Gamma-ray images -- RHESSI, 2002 July 23 flare SOHO/MDImagnetogram HXR emission Gamma rays
. • Spectral resolution best for RHESSI Detectors 3 and 4: 1 keV at ~ 7 keV or ~0.25Å at 1.9Å. • Spectral resolution “broad-band”, not like crystal spectrometer resolution. • RHESSI sees Fe XXV lines and satellites as a single “bump” on continuum. • However, RHESSI does see the continuum (whereas crystal spectrometers usually affected by crystal fluorescence).
Flare X-ray Spectra • Electrons accelerated at reconnection site travel from loop top to chromosphere, producing X-ray emission with nonthermal spectrum (hv > 20 keV). • Material in previously empty loop filled with heated plasma (T~20MK) that produces a thermal spectrum (hv < 20 keV) consisting of lines and continuum.
Two Line features in RHESSI spectra 6.7 keV or “Fe line feature” • Fe XXV lines • Fe XVIII – Fe XXIV satellites • Fe XXVI lines at higher T (>80MK) • Seen with crystal spectrometers 8 keV or “Fe/Ni line feature” • More highly excited Fe XXV,Fe XXVI lines • Ni XXVII, Ni XXVIII lines & satellites • Never seen with crystal spectrometers
Fe and Fe/Ni line features: RHESSI observations So RHESSI the first instrument (apart from NEAR-PIN) to see the 8 keV feature By analyzing the 2 line features, one can diagnose the hottest part of the flare thermal plasma
Ca XIX Chianti Spectrum,T=20MK Fe XXV Fe XXV Fe XXVI Fe XXV +satellites Ni XXVII + sats Fe edge
Chianti spectra + spectra smoothed to RHESSI resolution
SMM/BCS Fe line flare spectra Fluorescence background
Synthetic (CHIANTI) spectra, solar plasma (8-33 MK) RHESSI (1 keV) resolution assumed Chianti: coronal abund. + Mazzotta et al. ion. eq.
Solar flare spectrum, NEAR- PIN and Yohkoh/BCS S XV BCS NEAR-PIN: R. Starr Yohkoh: S, Ca, Fe channels Ca XIX NEAR-PIN Fe line (6.7 keV) Fe/Ni line (8 keV)
Element (e.g. Fe) Abundances • With measurement of line and continuum flux, we can measure element abundances • Thus, with 6.7 keV (“Fe line”) feature, we can measure Fe/H. • Use equivalent width of line to do this.
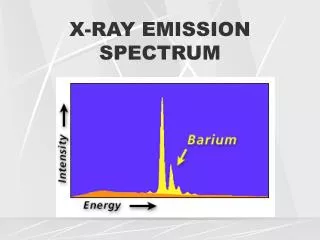
Emission Line Equivalent Width Definition Energy (keV)
Equivalent Width of the Fe line Based on Chianti v. 5.1, coronal abundances and Mazzotta et al. ion fractions (This plot is different from Phillips 2004)
Attenuator states RESIK in 3rd order
Theoretical curve (Phillips 2004) based on coronal Fe abundance and Mazzotta et al. ion fractions
Fe Theoretical curve
Equivalent Width Plots • April 23, 2003 flare is `good’ example – plenty of not-so-good examples! • There are problems associated with high count rates in the A0 attenuator state and in the A3 attenuator state – these are not understood at present. • Cristina will show more examples…. • Tentative conclusion: flare Fe abundance ~ coronal Fe abundance (Feldman & Laming 2000)
Fe XXIV/Fe XXV Ion Fractions wrong? • In CHIANTI analysis, we used Mazzotta et al. (1998) ion fractions – maybe slightly wrong? • No measured rates for these ions, so everything relies on calculations • There are some ‘measured’ rates from SMM/BCS flare spectra: Fe XXIV satellites (j and q) / Fe XXV w line ratios (Antonucci et al.)
RHESSI and CORONAS-F/RESIK Solar Flare Spectra • Both RHESSI and RESIK spectrometers carefully calibrated – estimated uncertainties ~20% • Useful to compare spectra for same times in flares – agreement very good. • RESIK 1st-order spectra agree with the low-energy end of RHESSI spectra.
Summary and Conclusions • RHESSI a `broad-band’ spectrometer, sees both thermal and nonthermal spectra of solar flares (sp. res. 1 keV). • RHESSI sees two line features, at 6.7 keV (Fe) and 8 keV (Fe/Ni). • Line equivalent widths mostly indicate coronal abundance of Fe. • Possibly ionization fractions of Fe XXV need revision.