Download
1 / 44
440 likes | 581 Vues
X-ray and UV spectroscopy of the Sun and Flare Stars. Ken Phillips Postgraduate Lecture December 18, 2008. Recommended reading. Introduction to Stellar Astrophysics , vol. 2 (Stellar Atmospheres). E. B ö hme-Vitense (CUP, 1989) The Solar Transition Region . J. Mariska (CUP, 1992)

E N D
X-ray and UV spectroscopy of the Sun and Flare Stars Ken Phillips Postgraduate Lecture December 18, 2008
Recommended reading Introduction to Stellar Astrophysics, vol. 2 (Stellar Atmospheres). E. Böhme-Vitense (CUP, 1989) The Solar Transition Region. J. Mariska (CUP, 1992) Ultraviolet and X-ray Spectroscopy of the Solar Atmosphere. K.J.H. Phillips, U. Feldman, E. Landi (CUP, 2008) Space Science (eds L. Harra and K. Mason: Imp. College Press, 2004) esp. chapter 8 Atomic Spectra.2nd ed. H. G. Kuhn (Longman 1969) Atomic Spectra and Atomic Structure. G. Herzberg (tr. Spinks) (Dover 1944)
Atmospheres of “active” stars and the Sun Flare stars and the Sun have hot atmospheres, usually acorona(temperature ~ 106 K) plus a chromosphere(~10,000 K) and “transition region”(~105 K). These temperatures are generally much hotter than their surfacetemperatures. E.g. The Sun has surface (photospheric) T ~ 6000K but its corona has T~106K
Why are some stellar atmospheres hot? Some stellar atmospheres are hot because there is a non-radiativeenergy source. This is associated with amagnetic fieldpresent in the convective zone of its interior. Heating may occur by either dissipation of MHD wavesor numerous tiny flares. The magnetic field continually re-created by an α-ωdynamoaction in the stellar interior – differential rotation (ω) + convection (α).
HR diagram for nearby stars RS, XC NC = no coronae, just cool winds NC RS = RS CVn binaries. XC = X-ray coronae MS stars liable to have coronae
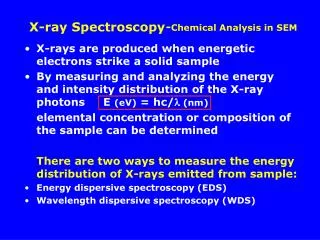
Some preliminaries In visible, UV and X-rays, nm is SI unit of wavelength but in solar physics still generally use wavelengths in Ångströms: 1Å = 0.1nm For X-rays, sometimes use energies in keV rather than wavelengths:E(keV) = 12.4 / λ (Å)
Spectral units “Spectral flux” – spectral irradiance– measured in erg cm-2 s-1Å-1(cgs) or W m-2 nm-1(SI) or W m-2 nm-1 Hz-1 (SI frequency units). For X-rays or UV radiation, units often in photonscm-2 s-1Å-1(cgs) or photons m-2 s-1nm-1(SI) “Spectral intensity” – spectral radiance– units: erg cm-2 s-1 Å-1 sr-1(cgs) or W m-2 nm-1 sr-1(SI).
Example of a spectrum -- but ideally spectral irradiance is in SI units (W m-2 nm-1) and wavelength in nm.
Emission from solar and stellar atmospheres Chromospheres and transition regions: fromEUV(100-1000 Å) to UV(>1000Å) Coronae: from EUVtosoft X-rays (<100Å) Active regions: from EUVtosoft X-rays Flares: from EUVtohard X-rays (<1Å)
Line emission Line emission from abundant elements – H, He, C, N, O, Ne, Mg, Al, Si, S, Ar, Ca, Fe. Elements normally ionized, e.g. in stellar coronae: C in form of C+3, C+4, C+5; Fe is in form of Fe+9, Fe+10… Fe+16. Often useiso-electronic series to describe an ion, e.g. C+4 is “He-like” (2 electrons), C+5 is “H-like” (1 electron). Only ions with at least one electron can emit lines – e.g. C+6 is fully stripped C, so cannot emit lines.
Ion and spectrum notation Atom or Ionproduces spectrum: Neutral H H I (first spectrum) Neutral He He I (1st spectrum) He+1 He II (2nd spectrum) Neutral C C I C+4 (He-like) C V Fe+16 (Ne-like) Fe XVII Fe+24 (He-like) Fe XXV Note: “H II regions” doesn’t make sense!
Electron configurations Electrons in an atom have 4 quantum numbers, n (principle q.n. related to distance from nucleus), l (orbital or azimuthalq.n. related to angular momentum and thus shape of orbit), ml (orientation w.r.t. mag. field) of orbital plane), ms (orientation of electron spin). No two electrons can have same set of 4 q.n.’s(Pauli’s exclusion principle).
Notation for configurations Principal quantum number n = 1, 2, 3,... Orbital quantum number l for a given n can have values 0, 1, ..., n - 1 Notation used is s (l =0), p (l =1), d (l =2), f (l =3) .... For given n, orbit with largest l is circular, those with smaller l’’s progressively more elliptical.
Electron configurations H-like ion: one electron, configuration in ground state is 1s (n=1, l=0, spin either up or down) He-like ion: 2 electrons, g.s. config. is 1s2(spins up and down) Li-like ion: 3 electrons, g.s. config. is 1s2 2s Ne-like ion: 10 electrons, g.s. config. is 1s2 2s2 2p6 (2s e’s elliptical orbits, 2p e’s in circular orbits) Ar-like ion: 18 electrons, g.s. config. is 1s2 2s2 2p6 3s2 3p6
Pauli’s exclusion principle explains “chemistry” He, Ne, Ar, Kr have closed subshells (1s2, 2p6, 3p6 etc.) – inert (“noble”) gases Na, K have single outer electron (3s, 4s) – highly reactive F, Clhave subshells “missing” an electron in outer shell. So Na, Clhave strong affinity for each other –NaCla common molecule
Pauli’s principle and the Periodic Table Filled sub-shells 1 outer e
Atomic transitions In a stellar atmosphere, an atom or ion is normally in its ground state, but can be excited (by e- collisions) to an upper level. A radiative transition back to the ground state or some lower state may follow, resulting in line emission, i.e. emission of a quantum hν E.g. H-like ions may undergo excitation from 1s to 2p, followed by a 2p →1s transition, resulting in a “Lyman-α” line photon (1216Å for H, 304Å for He II etc.)
Ionization conditions Stellar atmospheres are low-density, hot plasmas. Generally, for ionization, only collisional processes important (e- = a free electron): X+m + e-1 -> X+m+1 + e-1 + e-2 Recombination processes are either radiative(hν= photon) : X+m+1 + e- -> X+m +hν or dielectronic: X+m+1 + e- -> (X+m)** (doubly excited)
Ionization equilibrium In the quiet solar corona, and to a 1st approximation in active regions (or maybe even flares), there is ionization equilibrium: Number of ionizations/unit vol. and time = No. of recombinations/unit vol. and time: Ne N(X+m) Q(T) = Ne N(X+m+1) α(T) where Q(T) = rate coefft. of ionization, α(T) = rate coefft. of recombination. From this one can calculate all the ion fractions for a particular element as a function of T. [Note: ionization equilibrium is NOT the same as LTE! LTE holds in the solar photosphere.]
Fe ion fractions as a function of temperature Te 9 = fractional abundance of Fe+9 ions: N(Fe+9)/N(Fe)
Line excitation from stellar atmospheres UV and X-ray lines excited by collisions of e’s with ions, followed by spontaneous radiative de-excitation: X+m + e- -> (X+m)* + e- (X+m)* -> X+m + hνline [hνline= line photon; asterix * means ion is excited]
Line radiant fluxes Line emission F (photons s-1) from an emitting volume V, electron density Ne, ion density N(X+m) is: F = NeN (X+m) Cij(T ) V = Ne2V×[(N(X+m)/N(X)]×[N(X)/N(H)]×[N(H)/Ne]×Cij (T) where Cij = collisional rate coefficient (cm3 s-1) F = Ne2V×f (T ) ×Ab(X) × 0.8 × Cij (T ) Ne2V is the (volume) emission measure (cm-3) f (T ) = ionization fraction = N(X+m)/N(X) Ab(X) = abundance of element (X)relative to H.
Line irradiance (flux) at Earth or SOHO etc. Line radiant flux (or power) F is number of photons (or ergs or J) from an emitting volume V. At Earth, theline irradiance (or flux) is F / (1 A.U.)2 where 1 A.U. = 1 astronomical unit = 150 × 106 km. Units are photons cm-2 s-1. Note SOHO is at inner Lagrangian (L1) point which is 148.5 × 10⁶ km from Sun ~ 1 A.U. to ~1% (therefore fluxes to within ~2%).
Lagrangian points: an aside! There are 5 Lagrangian points for the Earth’s motion round the Sun. 3 of these points are on the Sun—Earth line, L1 (inner), L2 and L3 are beyond the Earth and Sun. L1 is NOT the centre-of-mass point!! It is defined by the balance of the centripetal acceleration (v2/r) and the net gravitational acceln. of the Sun and Earth.
Hinode/EIS spectrum from quiet Sun Fe XII Fe XI He II
Some strong lines in EIS spectra Fe IX 171.0 ÅTransition 3p6 – 3p5 3d. A “resonance” line. Near edge of EIS channel 1, so always weak. Fe X 174.8 ÅTransition 3p5 – 3p4 3d. Fe XI 180.4 Å Transition 3p4 – 3p3 3d. Fe XII 195.1 Å Transition 3p3 – 3p2 3d. Main contributor to TRACE/EIT/STEREO “195” channel. He II 256.3 Å Transition 1s – 3p (Ly-β), emitted in chromosphere.
Typical X-ray stellar spectra Sun-like stars with hot coronae Degree of activity Age
What do UV and X-ray spectra tell us? Temperatures(Te) or distribution of material with Te differential emission measure Densities(Ne) Plasmaflowsandturbulence Elementabundances
Temperatures from spectral line ratios Several temperature “diagnostics”, including lines from different ions of same element (e.g. Fe XXVI/Fe XXV lines in solar flare X-ray spectra) Lines of same ion with different excitation energies (e.g. Ly-α/Ly-β of H-like ions) For solar flares, “dielectronic satellite” lines/nearby resonance X-ray lines often used.
P78-1 Fe XXV solar flare spectra Flare peak Flare decay w = 1s2 – 1s2p j = 1s2 2p – 1s2p2 Satellite j / res. line w = f(Te) Doschek et al. (1980)
Electron densities from line emission: O VII lines OVII Spectrum line ratio R = I(22.1Å)/I(21.8Å) Level diagram R = line m-1 / line 3-1
O VII ratios in a solar flare SOLEX spectra from P76-1 spacecraft: Doschek et al. (1981)
O VII lines in AB Doradus XMM-Newton RGS spectra of rapidly rotating K main sequence star AB Dor (Güdel et al. 2001)
Case of Capella Capella: spectroscopic binary - two G-type giants, separation 157 solar radii, period ~100 days. O VII triplet in Chandra spectra – Ne = 2 x 1010 cm-3. EM (for both stars) is Ne2 V ~ 1052 cm-3. Volume ~2.5 x 1031 cm3, x100 less than solar corona, 105 less than the vol. of each star. If uniform, coronae of two stars have depth ~ 30 km Maybe coronae are made up of lots of small loops.
Capella’s “Quiescent” X-ray Spectrum (8 – 20 Å) Quiescent Capella spectrum Solar flare in 1980 Capella spectrum is like a low-temperature (4-6MK) solar flare
Density-dependent line ratios in the UV, EUV & X-ray regions 4d level 59.6 Å 59.0 Å Fe+13 level diagram Ratio of Fe XIV X-ray lines, I (59.6)/I (59.0) = function of Ne 3p levels 5303 Å
Turbulence and flows Turbulent events (TE) and jets observed by HRTS in the UV from solar transition region lines. Brueckner & Bartoe (1983) Note: SUMER results suggest they are the same. Velocities up to 400 km/s.
X-ray lines at the start of solar flares: upflows and turbulence Ca XIX lines formed at ~10 MK, seen at the “impulsive” stage of a solar flare in 1980 with the BCS on SMM. Upflow vels. ~ 200 km/s Spectrum from stationary plasma Spectrum from upflowing plasma
Element abundances: the “FIP” effect In the solar atmosphere, the abundances of Mg, Al, Si, K, Ca, Fe are enhancedrelative to the photosphere – up to x 4. These elements all havelow first ionization potentials, FIPs (< 10 eV) Possibly amagnetic/electric field mechanism which takes the partially ionized material of photosphere into the corona as it rises. For some or even most active stars, there is an “inverse” FIP effect (O is v. abundant).
Element Abundances With atomic parameters describing the line, the element abundance can be deduced from line flux measurements K abundance from He-like K (K XVII) line in RESIK X-ray solar flare spectra (Sylwester et al. 2004)
Summary The Sun and flare (“active”) stars have hot coronaeand produce flares Their energetic atmospheres are the source of X-ray and UV emission UV and X-ray spectroscopy tells us some parameters describing their atmospheres: temperatures, densities, flows, and element abundances