Bioinformatics Applications and Feature Selection for SVMs S. Mukherjee
350 likes | 515 Vues
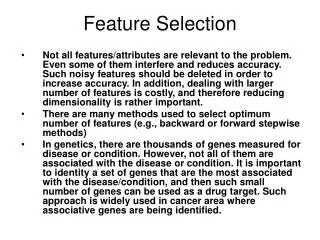
Bioinformatics Applications and Feature Selection for SVMs S. Mukherjee. Outline. I. Basic Molecular biology II. Some Bioinformatics problems III. Microarray technology a. Purpose b. cDNA and Oligonucleotide arrays c. Yeast experiment IV. Cancer classification using SVMs

Bioinformatics Applications and Feature Selection for SVMs S. Mukherjee
E N D
Presentation Transcript
Bioinformatics Applications and Feature Selection for SVMs S. Mukherjee
Outline I. Basic Molecular biology II. Some Bioinformatics problems III. Microarray technology a. Purpose b. cDNA and Oligonucleotide arrays c. Yeast experiment IV. Cancer classification using SVMs V. Rejects and Confidence of classification VI. Feature Selection for SVMs a. Leave-one-out bounds b. The algorithm VII Results on several datasets
What is Bioinformatics Pre 1995 Application of computing technology to providing statistical and database solutions to problems in molecular biology. Post 1995 Defining and addressing problems in molecular biology using methodologies from statistics and computer science. The genome project, genome wide analysis/screening of disease, genetic regulatory networks, analysis of expression data.
DNA: CGAACAAACCTCGAACCTGCT Translation Some Basic Molecular Biology Transcription mRNA: GCU UGU UUA CGA Polypeptide: Ala Cys Leu Arg
Examples of Problems Gene sequence problems: Given a DNA sequence state which sections are coding or noncoding regions. Which sections are promoters etc... Protein Structure problems: Given a DNA or amino acid sequence state what structure the resulting protein takes. Gene expression problems: Given DNA/gene microarray expression data infer either clinical or biological class labels or genetic machinery that gives rise to the expression data. Protein expression problems: Study expression of proteins and their function.
Microarray Technology Basic idea: The state of the cell is determined by proteins. A gene codes for a protein which is assembled via mRNA. Measuring amount particular mRNA gives measure of amount of corresponding protein. Copies of mRNA is expression of a gene. Microarray technology allows us to measure the expression of thousands of genes at once. Measure the expression of thousands of genes under different experimental conditions and ask what is different and why.
Oligo vs cDNA arrays Lockhart and Winzler 2000
Cancer Classification 38 examples of Myeloid and Lymphoblastic leukemias Affymetrix human 6800, (7128 genes including control genes) 34 examples to test classifier Results: 33/34 correct d perpendicular distance from hyperplane d Test data
Nonlinear SVM Nonlinear SVM does not help when using all genes but does help when removing top genes, ranked by Signal to Noise (Golub et al).
Cancer g2 Reject Normal g1 Rejections Golub et al classified 29 test points correctly, rejected 5 of which 2 were errors using 50 genes Need to introduce concept of rejects to SVM
95% confidence or p = .05 d = .107 .95 Rejections for SVM P(c=1 | d) 1/d
Results with rejections Results: 31 correct, 3 rejected of which 1 is an error d Test data
Why Feature Selection • SVMs as stated use all genes/features • Molecular biologists/oncologists seem to be conviced that only a small subset of genes are responsible for particular biological properties, so they want which genes are are most important in discriminating • Practical reasons, a clinical device with thousands of genes is not financially practical • Possible performance improvement
d d Test data Test data Results with Gene Selection AML vs ALL: 40 genes 34/34 correct, 0 rejects. 5 genes 31/31 correct, 3 rejects of which 1 is an error. B vs T cells for AML: 10 genes 33/33 correct, 0 rejects.
The Basic Idea Use leave-one-out (LOO) bounds for SVMs as a criterion to select features by searching over all possible subsets of n features for the ones that minimizes the bound. When such a search is impossible because of combinatorial explosion, scale each feature by a real value variable and compute this scaling via gradient descent on the leave-one-out bound. One can then keep the features corresponding to the largest scaling variables. The rescaling can be done in the input space or in a “Principal Components” space.
R2/M2 =1 R2/M2 >1 R M = R M x2 x2 x1 Pictorial Demonstration Rescale features to minimize the LOO bound R2/M2
SVM Functional To the SVM classifier we add an extra scaling parameters for feature selection: where the parameters , b are computed by maximizing the the following functional, which is equivalent to maximizing the margin:
Toy Data Linear problem with 6 relevant dimensions of 202 Nonlinear problem with 2 relevant dimensions of 52
Face Detection On the CMU testset consisting of 479 faces and 57,000,000 non-faces we compare ROC curves obtained for different number of selected features. We see that using more than 60 features does not help.
p-val = 0.00039 p-val = 0.0015 Outcome Classification Error rates ignore temporal information such as when a patient dies. Survival analysis takes temporal information into account. The Kaplan-Meier survival plots and statistics for the above predictions show significance. Lymphoma Medulloblastoma