Analysis of ECG
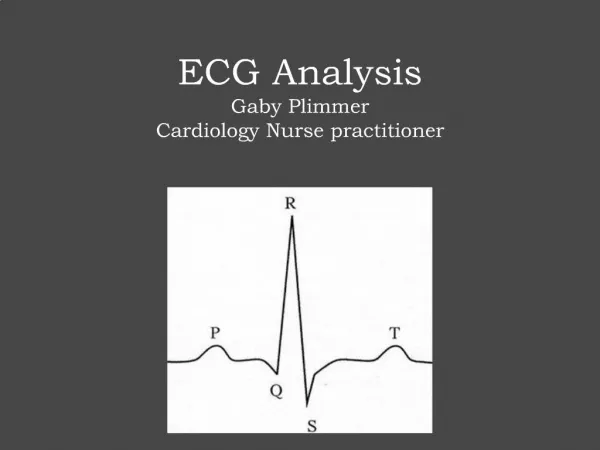
Analysis of ECG. Elecrtocardiogram. It is the method of registration of heart bioelectrical potential from the chest of patient. ECG analysis. The main elements of ECG curve are: - Waves P, Q, R, S and T. Sometimes U wave may occur;


Analysis of ECG
E N D
Presentation Transcript
Elecrtocardiogram • It is the method of registration of heart bioelectrical potential from the chest of patient
ECG analysis • The main elements of ECG curve are: • - Waves P, Q, R, S and T. Sometimes U wave may occur; • - Segments - P-Q (from the end of P wave to beginning of Q wave), S-T (from the end of S wave until beginning of T wave); • - Intervals, which characterize certain time period of heart activity - P-Q (from the beginning of P wave to beginning of Q wave), Q-T (from beginning of Q wave to end of T wave); • - Complexes - atria, which is presented by P wave, and ventricular -QRST.
ECG analysis • - P wave in healthy persons, is obligatory positive in I, II, AVF, V2-V6 leads. P wave may be negative in III, AVL and V1, either positive or biphasic. Normally in II lead its amplitude is 2.5 mm, duration - 0.1 s. • - P-Q interval reflects duration of AV-conduction, which is spreading of potential by AV node, His bundle and its branches. This interval lasts 0.12-0.20 s and depends on heartbeat rate.
ECG analysis • - QRST complex reflects spreading of excitation by ventricles. It hole amplitude is higher 5 mm of the waves are signed by capital letters. Otherwise it used little letters. ORS duration in II lead is not more than 0.1 s. • - Q wave normally in II lead is less then 1/4 of R amplitude duration is 0.03 s. Normally in AVR deep and wide Q waves may be recorded. In V1, V2 - Q wave is particularly absent.
ECG analysis • - R-view usually is recorded in all leads; exalt AVR, which may be absent. In unipolar chest leads R amplitude gradually increases from V1 to V4 and some decreases in V5 and V6. So normally in unipolar chest leads both increasing R-amplitude and S-amplitude occurs. S-wave has amplitude not more than 20 mm, but it varies from lead to lead.
ECG analysis • - S-T –segment corresponds to excitation of both ventricles. Normally in bipolar and unipolar leads it lies on baseline and don’t move more than 0.5 mm. In V1-V3 deviation upward to 2 mm may occur. • - T-wave normally is positive in I, II AVF, V2-V6, TI>TIII, TV6>TV1. T-wave has sloping ascend part and sleep descending part. In III, AVL, V1 T-wave may either be positive, negative or bipolar. In II lead T-amplitude is 5-6 mm, duration – 0.16-0.24 s.
ECG analysis • - Q-T interval is electrical systole of ventricles. Its duration directly depends on heartbeat rate. Proper duration may calculated by Buzett formula: • Q-T=K√¯R-R¯, where • K=0.37 in male or 0,40 in female • - U-wave may be recorded in unipolar chest leads, which reflects excitation fare of excitability after electrical systole of ventricles myocardium. U-wave usually is positive and small.
Scheme of artifacts on ECG • А –tremor of muscles; • В – influences of non stable current • С – changes of baseline of non stable current .
Points ofECG analysis • 1) Determining of impulse origin. Pay attention to proper order of waves in ECG. If P wave in II lead is positive and recorded before QRS complex is believed to determine pacemaker in SA node. • 2) Heart rhythm evaluation by measuring of R-R duration. Normally adjacent R-R intervals duration may differ from each other not more 0.1 s. Usually II lead is examined.
Points ofECG analysis • 3) Determining of heart rate. In proper rhythm 60 s is divided to R-R duration in seconds, which is calculated using paper speed. • 4) Evaluation of ECG voltage. If in bipolar limb leads the lowest R wave is smaller than 5 mm and RI+RII+RIII less than 15 mm, the ECG voltage is decreased. Otherwise it is normal.
Points ofECG analysis • 5) EMP direction determining. • - Visual method: needs measuring R amplitude in all bipolar limb leads. If true, that RII>RI>RIII, the EMP direction is near 30º-69º, that is normal; • - Graphic method use Baily co-ordinate. If in Einthoven’s triangle put through the center parallel to leads axes we’ll get Baily’s co-ordinate. Than in any two bipolar limbs leads it is necessary to determine summary amplitude of QRS waves. Upward waves have positive meaning and downward are negative. Summary amplitude put on corresponding axis with (+) or (-) sign. In this point lined perpendicular to lead axis. Next time determined cross point of two drown perpendiculars. When join this point to Baily’s co-ordinate center we’ll obtain the EMP direction outward the center.
Points ofECG analysis • 6) ECG elements analysis. Pay attention to form, amplitude and duration of waves and intervals. Measure deviation from baseline if it occurs. Compare the results with normal rate.