EG2234 Earth Observation
EG2234 Earth Observation. AGRICULTURE. TOPICS. Introduction Physical Theory (spectroscopy and biology) NOAA-AVHRR system NDVI Other Vegetation indices Crop yield measurement Discriminating between different crop species. Introduction. Agriculture is big business

EG2234 Earth Observation
E N D
Presentation Transcript
EG2234Earth Observation AGRICULTURE
TOPICS • Introduction • Physical Theory (spectroscopy and biology) • NOAA-AVHRR system • NDVI • Other Vegetation indices • Crop yield measurement • Discriminating between different crop species
Introduction • Agriculture is big business • A nation’s food supply affects both its economic status and political stability • In Europe and the US the greatest concern is profit and getting crops to market and obtaining a good price – whilst staying cheap • In the developing world the issue is food security and the wellbeing of the population
Introduction • Monitoring of crops from space or aircraft aids decision making • When to irrigate and what fertilizer is needed • Management of crop rotation and set-aside • Most large-scale commercial farms are so large that monitoring cannot be made on foot so remote sensing is the clear choice
Physical theory #1 • Reflectance curve shows LOW values in the RED (0.6 - 0.7µm) and BLUE (0.4 - 0.5µm) regions of the visible spectrum • There is a reflectance peak in the GREEN region (0.5 - 0.6µm) • Sharp rise in reflectivity at about 0.75 µm is the ‘red-edge’. Reflectivity remains high in the NIR
Physical theory #2 Plants use pigments called CHLOROPHYLL (a and b) to absorb mostly RED and BLUE visible light. The pigments are contained within the CHLOROPLASTS of the plant cell
Physical theory #2 Chlorophyll is concentrated in the GRANA which are just visible with a light microscope as dark green spots inside a chloroplast
Physical theory #2 Solar energy is converted into the potential energy of organic molecules in a pathway of reactions called PHOTOSYNTHESIS. A product of photosynthesis is a hexose sugar called glucose. 2880 kJ of solar energy is used in synthesising a single mole of glucose: 6CO2 + 6H2O C6H12O6 + 6O2 ΔG + 2880 kJ
Physical theory #2 • Chlorophyll does NOT absorb solar radiation equally - rather it absorbs chiefly RED and BLUE light (as much as 70-90%) in these spectral regions • Little of the green light is absorbed, and so is reflected making vegetation appear green • In the near infrared spectrum (unseen by human eyes), reflection is controlled by plant tissue
Physical theory #2 • The CUTICLE and EPIDERMIS are almost transparent to infrared (IR) radiation - thus very little IR radiation is reflected from the outside of a leaf • Mesophyll scatters radiation entering from the upper epidermis - with most (around 60%) being scattered upwards - as reflected energy • The internal structure of a living leaf is largely responsible for the bright IR reflectance measured by radiometers above vegetation
Physical theory #2 Lambertian Reflectance: Non-specular (i.e. diffuse) reflectance is known as a Lambertian reflectance Because of the scattering of radiation entered and leaving the mesophyll tissue of a living leaf, we can say that the degree of IR reflectance from the leaf is uniform from many angles
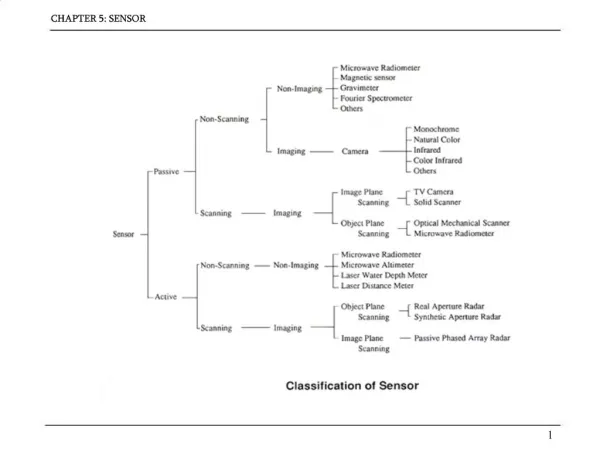
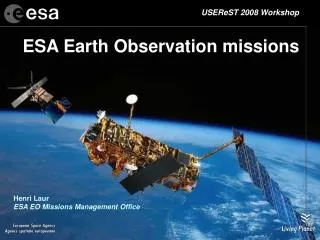
NOAA-AVHRR System Advanced Very High Resolution Radiometer
NOAA-AVHRR System • 4 or 5 channels (depending on model) • Senses visible, infrared and near infrared • Carried on NOAA’s polar orbiting satellites • High resolution data (HRPT and LAC) – 1.1km • Reduced (sub-sampled) GAC data – 8km • Data provides global coverage (pole to pole) • Each pass provides a 2399km swath • Satellite orbits 14 times each day from 833km
NDVI Normalised Difference Vegetation Index (NDVI): NDVI provides a good assessment of photosynthesising vegetation – but caution must be exercised with this type of index as other factors can affect the NDVI other than leaf reflectance: Viewing angle, Soil background, Atmospheric degradation and Leaf orientation
NDVI • Atmospheric interference: • Energy travelling from the earth to the satellite sensor must pass through the atmosphere • Energy is subject to interference by gases, aerosols, dust, smoke, water vapour etc • No simple way exists for removing these effects from NDVI which conspires to lower the NDVI value • One “trick” is to use maximum value composite data measured over some period of time (usually 10 days)
Other vegetation indices PVI (perpendicular vegetation index): One of the problems associated with remote sensing vegetation is mixed pixels – a combination of both soil and vegetation. Hutchinson (1982) found that it was difficult to separate soil and vegetation reflectance when vegetation cover is less than 30%. A solution to this problem is the exploitation of the SOIL BRIGHTNESS LINE (Richardson and Wiegand, 1977). Essentially the soil brightness tends to fall on a straight line – as soil becomes brighter in the near infrared (high NIR reflectance), so it is brighter in the red.
Other vegetation indices PVI (perpendicular vegetation index): B = dark wet soils C = dry soils X = pure vegetation pixel Y = mixed pixel
Other vegetation indices PVI (perpendicular vegetation index): Richardson and Wiegand quantified the difference between soil/mixed pixels and vegetation pixels by defining the PVI: S = soil reflectance R = red radiation V = vegetation reflectance IR = near infrared radiation
Other vegetation indices A “family” of other vegetation indices exist that try and correct for soil influences: SAVI soil adjusted vegetation index TSAVI transformed soil adjusted vegetation index GEMI global environment monitoring index And, more recently: OSAVI optimised soil adjusted vegetation index:
Flowchart for crop-yield estimation. Source: Kastens et al, 2005
Spectral signatures of sugar cane species. Source: Galvao et al, 2005