Understanding Supply: Law of Supply, Quantity Supplied, and Market Dynamics
This guide explores the fundamental concepts of supply in economics, including the law of supply, which states that higher prices lead to increased quantities supplied. It details how producers determine the amount of goods to supply, considering costs of production and market conditions. The supply schedule is introduced, illustrating the relationship between price and quantity supplied for a specific good. Market supply is also examined, showcasing the total quantity supplied by all firms. Key components such as the elasticity of supply and graphical representation through supply curves are discussed.

Understanding Supply: Law of Supply, Quantity Supplied, and Market Dynamics
E N D
Presentation Transcript
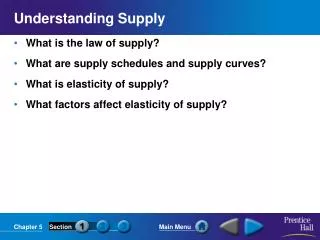
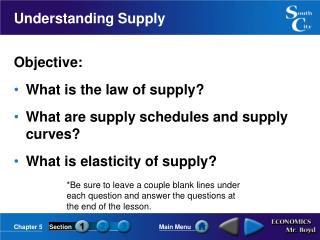
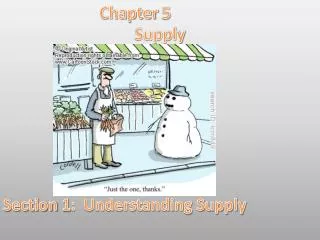
Understanding Supply HSCE 1.3.1
Supply • The Amount of goods available • How do producers decide on how much to supply? HSCE 1.3.1
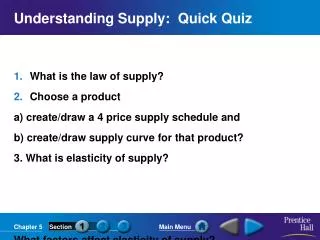
Law of Supply • The higher the price, the larger the quantity produced. +, + Positively Correlated • Companies will produce more of a higher priced good so their profits will increase. HSCE 1.3.1
Quantity Supplied • How much of a good is offered for sale at a specific price. • How much does it cost to produce, materials, shipping, etc... HSCE 1.3.1
Supply • As the price of a good rises, existing firms will produce more in order to earn additional revenue. • At the same time, new firms will enter the market • Disco music in 1970's, New bands started making music. HSCE 1.3.1
Supply Schedule • Supply Schedule - A table that shows the relationship between price and quantity supplied for a specific good. • Supply Schedule also shows the price, and how only the price affects output. • All other factors remain constant HSCE 1.3.1
Market Supply • Market Supply Schedule- • shows the relationship between prices and the total quantity supplied by all firms in a particular market. HSCE 1.3.1
Market Supply • When the data points in a supply schedule are graphed, they create a supply curve • Similar to a demand curve except horizontal axis measures the quantity of the good supplied. • It Rises from left to right HSCE 1.3.1
Elasticity of supply • A measure of the way suppliers respond to a change in price. HSCE 1.3.1
Understanding Supply HSCE 1.3.1
SUPPLY The amount of a good or service that producers are willing & able to supply at each price. HSCE 1.3.1
LAW OF SUPPLY Producers offer more of a good when its price is high and less when its price is low. OPPOSITE OF DEMAND! HSCE 1.3.1
Quantity Supplied Term used to describe how much of a good is offered at a specific price. HSCE 1.3.1
REMEMBER The goal of producers is… PROFIT HSCE 1.3.1
Supply Schedule Supply Schedule – shows relationship between price & quantity supplied for a specific good. Very similar to a demand schedule. HSCE 1.3.1
Market Supply Schedule Market Supply Schedule – same as for supply schedule but it includes all the firms in the market. HSCE 1.3.1
Graphical Representation Supply Curve – graphical representation of the supply schedule. - same as demand, except the horizontal (X) axis is quantity supplied not demanded. - Slopes up from left to right - OPPOSITE OF DEMAND! S HSCE 1.3.1
The End HSCE 1.3.1