Download

1 / 30
300 likes | 323 Vues
Explore the law of supply, supply schedules, and supply curves. Learn about elasticity of supply and factors that affect it. Discover how price changes impact supply and the relationship between price and quantity.

E N D
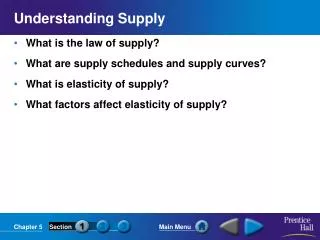
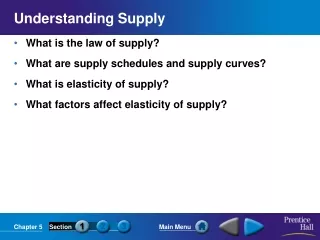
Understanding Supply • What is the law of supply? • What are supply schedules and supply curves? • What is elasticity of supply? • What factors affect elasticity of supply?
Price As price increases… Supply Quantity supplied increases Price As price falls… Supply Quantity supplied falls The Law of Supply • Supply is the amount of goods available. • According to the law of supply, suppliers will offer more of a good at a higher price. The higher the price, the larger the quantity produced
How Does the Law of Supply Work? • Economists use the term quantity supplied to describe how much of a good is offered for sale at a specific price. • The promise of increased revenues when prices are high encourages firms to produce more. • Rising prices draw new firms into a market to earn a profit for themselves and add to the quantity supplied of a good. • If price of a good falls, some firms will produce less and others might drop out of the market. • These two movements combine to create the law of supply: • individual firms changing level of production • firms entering or exiting the market
Higher Production • If firm is already earning profit by selling a good, then increase in price – ceteris paribus (all other things held constant)– will increase the firm’s profits. • Higher profit encourages increased production. • Search for profit drives supplier’s decision. • Increase in prices demonstrates chance to make more money. • Decrease in price discourages production levels.
Market Entry • Profits appeal to current producers and people who may decide to join market. • Rising prices draw new firms into the market and add to the quantity supplied of the good. • Output or quantity supplied of a good increases as the price of the good increases.
Supply Schedule • Shows the relationship between the price and quantity supplied for a specific good. • Supply schedule is a table that compares two variables (factors that can change) • Usually price and quantity • Lists supplies for a very specific set of conditions • A change in a good’s price moves the seller from one row to another in the same supply schedule but does not change the supply schedule itself. • All of the supply schedules of individual firms in a market can be added up to create a market supply schedule.
Market Supply Schedule Price per slice of pizza Slices supplied per day $.50 1,000 $1.00 1,500 $1.50 2,000 $2.00 2,500 $2.50 3,000 $3.00 3,500 Supply Schedules • A market supply schedule shows the relationship between prices and the total quantity supplied by all firms in a particular market. • It is a chart that lists how much of a good all suppliers will offer at different prices. More pizza at higher prices!
Market Supply Curve 3.00 2.50 2.00 1.50 1.00 .50 0 Supply Price (in dollars) 0 500 1000 1500 2000 2500 3000 3500 Output (slices per day) Supply Curves • Data points in a supply schedule are graphed to create a supply curve. • A market supply curve is a graph of the quantity supplied of a good by all suppliers at different prices. • Key feature in supply curve – always rises from right to left, moving towards higher and higher output (or supply) levels • Illustrates law of supply that states that higher price leads to higher output
If supply is not very responsive to changes in price, it is considered inelastic. An elastic supply is very sensitive to changes in price. Elasticity of Supply Elasticity of supply is a measure of the way suppliers react to a change in price. Tells how firms will respond to changes in the price of a good
Time In the long run, firms are more flexible, so supply can become more elastic. What Affects Elasticity of Supply? In the short run, a firm cannot easily change its output level, so supply is inelastic.
Section 1 Assessment 1. What is the law of supply? (a) the lower the price, the larger the quantity supplied (b) the higher the price, the larger the quantity supplied (c) the higher the price, the smaller the quantity supplied (d) the lower the price, the more manufacturers will produce the good 2. What happens when the price of a good with an elastic supply goes down? (a) existing producers will expand and some new producers will enter the market (b) some producers will produce less and others will drop out of the market (c) existing firms will continue their usual output but will earn less (d) new firms will enter the market as older ones drop out
Section 1 Assessment 1. What is the law of supply? (a) the lower the price, the larger the quantity supplied (b) the higher the price, the larger the quantity supplied (c) the higher the price, the smaller the quantity supplied (d) the lower the price, the more manufacturers will produce the good 2. What happens when the price of a good with an elastic supply goes down? (a) existing producers will expand and some new producers will enter the market (b) some producers will produce less and others will drop out of the market (c) existing firms will continue their usual output but will earn less (d) new firms will enter the market as older ones drop out
Costs of Production • How do firms decide how much labor to hire? • What are production costs? • How do firms decide how much to produce?
Marginal Product of Labor Labor (number of workers) Output (beanbags per hour) Marginal product of labor 0 0 — 1 4 4 2 10 6 3 17 7 4 23 6 5 28 5 6 31 3 7 32 1 8 31 –1 A Firm’s Labor Decisions • Basic question of any Business owner: how many workers to hire? • Answer: MUST consider how the number of workers they hire will affect their total production. • The marginal product of labor is the change in output from hiring one additional unit of labor, or worker. It is called the marginal product because it measures the change in output at the margin, where the last worker has been hired or fired. This table shows the relationship between the # of workers in the factory and the # of beanbags produced.
Increasing marginal returns 1 2 3 Marginal Returns Increasing marginal returns occur when marginal production levels increase with new investment. As workers are added, specialization increases output per worker. Increasing, Diminishing, and Negative Marginal Returns 8 7 6 5 4 3 2 1 0 –1 –2 –3 Diminishing marginal returns Diminishing marginal returns occur when marginal production levels decrease with new investment. As the firm hires additional workers, benefits of specialization end. At that point, adding more workers increases total output, but at a decreasing rate. Negative marginal returns Marginal Product of labor (beanbags per hour) 8 9 4 5 6 7 Negative marginal returns occur when the marginal product of labor becomes negative. Adding too many workers actually decreases output. At this stage workers get in each other’s way and disrupt production. Labor(number of workers)
Production Costs • A fixed cost is a cost that does not change, regardless of how much of a good is produced. Most fixed costs involve the facility. Examples: rent, property taxes, repairs, salaries of non-production employees • Variable costs are costs that rise or fall depending on how much is produced. Examples: costs of raw materials, production related labor costs, heat, electricity • The total cost equals fixed costs plus variable costs. • The marginal cost is the additional cost of producing one more unit of a good.
Production Costs Beanbags (per hour) Fixed cost Variable cost Total cost (fixed cost + variable cost) Marginal cost Marginal revenue (market price) Total revenue Profit(total revenue – total cost) 0 1 2 3 4 $36 36 36 36 36 $0 8 12 15 20 $36 44 48 51 56 — $8 4 3 5 $24 24 24 24 24 $0 24 48 72 96 $ –36 –20 0 21 40 5 6 7 8 36 36 36 36 27 36 48 63 63 72 84 99 7 9 12 15 24 24 24 24 120 144 168 192 57 72 84 93 9 10 11 12 36 36 36 36 82 106 136 173 118 142 172 209 19 24 30 37 24 24 24 24 216 240 264 288 98 98 92 79 Setting Output • Marginal revenue is the additional income from selling one more unit of a good. It is usually equal to price. • To determine the best level of output, firms determine the output level at which marginal revenue is equal to marginal cost. The ideal level of output is where marginal revenue (price) is equal to marginal cost. Any other quantity of output would generate less profit.
Responding to Price Changes • What happens if price rises? • Thinking at the margin, we predict the firm would increase production to the price at which the marginal cost if equal to the new, higher price. • Marginal revenue would soar above marginal cost at that level of output and allow the firm to capture profits previously unrealized. • This is the law of supply in action.
The Shutdown Decision • Consider the problems faced by a factory that is losing money. • Factory is producing at a level of output at which marginal revenue is equal to marginal costs. • However, market price is so low that factory’s total revenue is still less than total cost, and therefore, losing money. • Should the factory continue to produce goods and lose money or should the owners shut down? • The firm should keep the factory open if the total revenue from goods and services the factory produces is greater than the cost of keeping it open (operating costs). Keep in mind the owners must pay FIXED costs even if the factory is closed. • Operating costs – include variable costs but not fixed costs which are only paid when the factory is running.
The Shutdown Decision • Consider the other choice. If the firm were to shut down the factory, it would still have to pay ALL of the fixed costs. • Total revenue would be ZERO because it is producing NADA and it would lose an amount of $$ equal to its fixed costs. • The factory would lose money either way but it would lose less money by continuing to produce goods as long as total revenue exceeded variable costs. That would leave some revenue to cover part of the fixed costs. • The factory is losing money either way but it is losing LESS money by continuing production. • How long will a firm continue to operate a factory at a loss? It will stay in the market only if the market price of the good is high enough to cover all production costs.
Section 2 Assessment 1. What are diminishing marginal returns of labor? (a) some workers increase output but others have the opposite effect (b) additional workers increase total output but at a decreasing rate (c) only a few workers will have to wait their turn to be productive (d) additional workers will be more productive 2. How does a firm set its total output to maximize profit? (a) set production so that total revenue plus costs is greatest (b) set production at the point where marginal revenue is smallest (c) determine the largest gap between total revenue and total cost (d) determine where marginal revenue and profit are the same
Section 2 Assessment 1. What are diminishing marginal returns of labor? (a) some workers increase output but others have the opposite effect (b) additional workers increase total output but at a decreasing rate (c) only a few workers will have to wait their turn to be productive (d) additional workers will be more productive 2. How does a firm set its total output to maximize profit? (a) set production so that total revenue plus costs is greatest (b) set production at the point where marginal revenue is smallest (c) determine the largest gap between total revenue and total cost (d) determine where marginal revenue and profit are the same
Changes in Supply • How do input costs affect supply? • How can the government affect the supply of a good? • What other factors can influence supply?
Input Costs and Supply • Any change in the cost of an input such as the raw materials, machinery, or labor used to produce a good, will affect supply. • A rise in the cost of an input will cause a fall in supply at all price levels because the good has become more expensive to produce. • The reverse is also true: a fall in the cost of an input will cause an increase in supply at all price levels.
Effect of Rising Costs • As input costs increase, the firm’s marginal costs also increase, decreasing profitability and supply. • Explanation?? • Supplier sets output at the most profitable level, where price is equal to marginal cost. Marginal cost includes the cost of the inputs that go into production, so a rise in the cost of labor or raw material will translate directly into a higher marginal cost. If cost of inputs increase enough, marginal cost may become higher than the price, and the firm may not be as profitable as it could be. • If firm has no control over price, only solution is to cut production and lower marginal cost until it equals the lower price. Supply falls at each price.
Technology • Input costs can also decrease. Advances in technology can lower production costs and increase supply at all price levels in many industries. • Ex: sophisticated robotics, computers, e-mail
Government Influences on Supply • By raising or lowering the cost of producing goods, the government can encourage or discourage an entrepreneur or industry within the country or abroad. Subsidies A subsidy is a government payment that supports a business or market. Subsidies cause the supply of a good to increase. EX: paying farmers to take land out of cultivation Taxes The government can reduce the supply of some goods by placing an excise tax on them. An excise tax is a tax on the production or sale of a good which increases production costs by adding an extra cost for each unit sold. EX: tax on harmful products like cigarettes, alcohol, high-pollutant gas Regulation Regulation occurs when the government steps into a market to affect the price, quantity, or quality of a good. Regulation usually raises costs. EX: lead-free gas, emissions technology on car exhaust
Other Factors Influencing Supply • The Global Economy • The supply of imported goods and services has an impact on the supply of the same goods and services here. • Government import restrictions will cause a decrease in the supply of restricted goods. • Future Expectations of Prices • Expectations of higher prices will reduce supply now and increase supply later. Expectations of lower prices will have the opposite effect. • Number of Suppliers • If more firms enter a market, the market supply of the good will rise. If firms leave the market, supply will decrease.
Section 3 Assessment 1. What affect does a rise in the cost of raw materials have on the cost of a good? (a) A rise in the cost of raw materials lowers the overall cost of production. (b) The good becomes cheaper to produce. (c) The good becomes more expensive to produce. (d) This does not have any affect on the eventual price of a good. 2. When government actions cause the supply of a good to increase, what happens to the supply curve for that good? (a) It shifts to the left. (b) It shifts to the right. (c) It reverses direction. (d) The supply curve is unaffected.
Section 3 Assessment 1. What affect does a rise in the cost of raw materials have on the cost of a good? (a) A rise in the cost of raw materials lowers the overall cost of production. (b) The good becomes cheaper to produce. (c) The good becomes more expensive to produce. (d) This does not have any affect on the eventual price of a good. 2. When government actions cause the supply of a good to increase, what happens to the supply curve for that good? (a) It shifts to the left. (b) It shifts to the right. (c) It reverses direction. (d) The supply curve is unaffected.