Statistical Diagrams
160 likes | 341 Vues
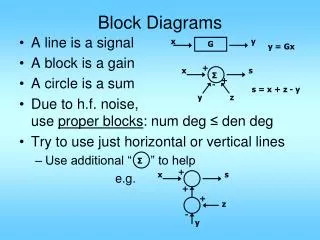
Statistical Diagrams. Construction & Analysis. Bar Charts. Y axis. These statistical diagrams are used for discrete data. Step 1 : Use a ruler and create x and y axes. X axis. Step 2: Label the x axis with data labels. Step 3: Insert the y axis data values and label.

Statistical Diagrams
E N D
Presentation Transcript
Statistical Diagrams Construction & Analysis
Bar Charts Y axis These statistical diagrams are used for discrete data. Step 1: Use a ruler and create x and y axes. X axis
Step 4: Compare the table values with the values on the y axis and draw bars to represent the data
Step 7: Analyze the chart by answering the following questions: • Which x axis label has the highest value? • Which x axis label has the lowest value? • Are there any trends?
Line Graphs Y axis These are used for continuous data. Step 1: Use a ruler and create x and y axes. X axis
Step 4: Compare the table values with the values on the y axis and insert markers (dots) by matching label to value Courtesy of Caribbean Institute of Meteorology & Hydrology (2014)