Download
1 / 13
130 likes | 408 Vues
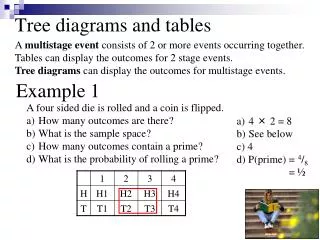
Tree Diagrams. Slideshow 58, Mathematics Mr Richard Sasaki, Room 307. Review how tree diagrams appear Draw tree diagrams for three events Introduce tree diagrams where events are dependent. Objectives. Tree Diagrams.

E N D
Tree Diagrams Slideshow 58, Mathematics Mr Richard Sasaki, Room 307
Review how tree diagrams appear Draw tree diagrams for three events Introduce tree diagrams where events are dependent Objectives
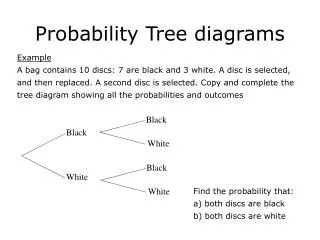
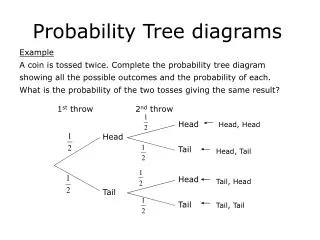
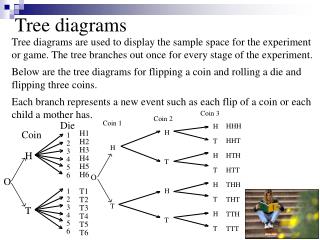
Tree Diagrams We know that tree diagrams can hold information for over two events with success / fail outcomes. Event A Event B P(AB) P(B) P(A)) P(B’) P(AB’) P(B) P(A’B) P(A’) P(B’) P(A’B’)
We multiply three numbers for each branch instead of two. It’s the same idea! Tree Diagrams Sometimes however, there are more branches, or even three events. Event C Event B P(C) Event A P(ABC) P(C’) P(B) P(ABC’) P(C) P(A) P(AB’C) P(C’) P(B’) P(AB’C’) P(C) P(A’BC) P(B) P(C’) P(ABC’) P(C) P(A’) P(AB’C) P(C’) P(B’) P(AB’C’)
Answers - Easy Coin C Coin B = Coin A P(C) P(B) P(A)= P(C’) = P(A) P(C) = P(B’) P(C’) = P(A)= = P(C) P(B) P(C’) P(A’) = P()= or = P(C) P(B’) P(C’) = Event C P(A’)= Event B Event A P(C) P(B) P(C’) P(A) P(C) P(1 at least twice)= P(B’) P(C’) P(C) P(B) 1 - P(A’)= P(C’) P(A’) P(C) P(B’) P(C’)
Answers- Hard Event C Event B Event A P(C) P(B) P(C’) P(A) P(C) P(B’) P(C’) P(C) P(B) P(C’) P(A’) P(C) P(B’) P(C’) No. The outcome of A clearly changes the probability of B being successful.
Dependence What is dependence? Dependence is the opposite of independence. It means that two (or more) things do affect each others outcome. In this example, we can see if A is successful, B is likely to be successful too. But if A fails, B is likely to fail as well. Event A Event B 0.9 P(A)) 0.4 0.1 0.6 0.2 P(A’) 0.8
Conditional Probability Now for dependent events A and B, on a question on the last worksheets, we saw B1 and B2. This is because we knew . Because A causes them to be. (they are dependent to A.) Why are B1 and B2 different? Event A Event B 0.9 P(A)) 0.4 0.1 0.6 0.2 P(A’) 0.8
Conditional Probability What are the meanings of though? How can we define between them? B1 is . given that A was successful B2 is . given that A was unsuccessful Event A Event B If something happens differently because of something else, we call this a condition. This is why this is conditional probability. 0.9 P(A) 0.4 0.1 0.6 0.2 P(A’) 0.8
Notation – Conditional Probability | “Given that” is denoted by the symbol ‘ ’. So the probability of B being successful given that A was successful is denoted as . P(B|A) = Event A Event B P(B|A) P(A) P(B’|A) P(B|A’) P(A’) P(B’|A’)
Example A forgetful man leaves his house. There is chance that he remembers to lock his door. If he locks his door, there is a chance of him being robbed. But if he forgets, the chance is . Event A Event B = P(B|A) P(A) P(B’|A) = = P(B|A’) P(A’) = P(B’|A’)
Event B Event B Event A P(B|A) Event A P(B|A) P(A) 0.7 P(A) 0.1 P(B’|A) P(B’|A) P(B|A’) 0.3 P(B|A’) P(A’) P(A’) 0.7 P(B’|A’) P(B’|A’) 0.63 P(B|A) = 0.9 0.3 0.09
Event B Event B Event A P(B|A) Event A P(B|A) P(A) P(A) 0.3 P(B’|A) P(B’|A) P(B|A’) 0.35 P(B|A’) P(A’) P(A’) 0.65 P(B’|A’) P(B’|A’) 0.285 A 0.05 0.3 1 - 1 – 0.0325 = 0.9675