Tree Diagrams
Tree Diagrams. * The tree diagram is an important way of organizing and visualizing outcomes. * When the information about probabilities associated with each branch is included, the tree diagram facilitates the computation of the probabilities of the different possible outcomes.


Tree Diagrams
E N D
Presentation Transcript
* The tree diagram is an important way of organizing and visualizing outcomes.
* When the information about probabilities associated with each branch is included, the tree diagram facilitates the computation of the probabilities of the different possible outcomes.
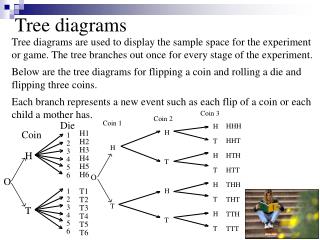
* The tree diagram is a particularly useful device when the experiment can be thought of as occurring in stages.
Example 1: Two Nights of Games Imagine that a family decides to play a game each night. They all agree to use a tetrahedral die (i.e., a four-sided pyramidal die where each of four possible outcomes is equally likely—see image on page 9) each night to randomly determine if they will play a board game (𝑩) or a card game (𝑪).
The tree diagram mapping the possible overall outcomes over two consecutive nights will be developed below. To make a tree diagram, first present all possibilities for the first stage. (In this case, Monday.) Monday Tuesday Outcome B C
Then, from each branch of the first stage, attach all possibilities for the second stage (Tuesday). Monday Tuesday Outcome B BB B C BC B CB C C CC
Now let’s add probabilities to the diagram? If all things are equal and they are flipping a coin to decide which game to play (heads for a board game and tails for a card game), what is the probability tree diagram going to look like on Wednesday WITH THE PROBABILITIES LISTED?
Monday Tuesday Wednesday Outcome B (.5) B (.5) BBB (.125) C (.5) BBC (.125) B (.5) B (.5) BCB (.125) C (.5) C (.5) BCC (.125) B (.5) CBB (.125) B (.5) C (.5) CBC (.125) C (.5) B (.5) CCB (.125) C (.5) C (.5) CCC (.125)
Now it is your turn….we are going to use a 4-sided triangular dice that is numbered 1, 2, 3 and 4. The number 1 is for a B (board game). The numbers 2, 3 and 4 are for C (card games). Can you complete the following tree showing the probability outcomes?
Is this what you came up with? .75 * .75 = .5625 or 56.25% .75 * .25 = .1875 or 18.75% .75 * .25 = .1875 or 18.75% .25 * .25 = .0625 or 6.25%
What we just did was…… Calculated the Probabilities of Compound Events
It is now your turn to try this….take the game situation we just worked on and complete Thursday’s probabilities. You are to work alone and turn it in before you leave today. What are the probabilities for the following: BBC BCB BCC CBB CCB CCC