Counting Outcomes and Tree Diagrams
300 likes | 1.04k Vues
Counting Outcomes and Tree Diagrams. Lesson 10.2. Theoretical probabilities can be determined by finding the ratio of the number of desired outcomes to the number of possible equally likely outcomes.

Counting Outcomes and Tree Diagrams
E N D
Presentation Transcript
Counting Outcomes and Tree Diagrams Lesson 10.2
Theoretical probabilities can be determined by finding the ratio of the number of desired outcomes to the number of possible equally likely outcomes. • In some cases it can be difficult to count the number of possible or desired outcomes. You can make this easier by organizing information and counting outcomes using a tree diagram.
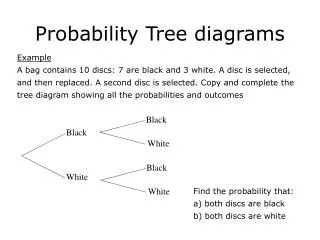
Example A • A national advertisement says that every puffed-barley cereal box contains a toy and that the toys are distributed equally. Talya wants to collect a complete set of the different toys from cereal boxes. • a. If there are two different toys, what is the probability that she will find both of them in her first two boxes? • b. If there are three different toys, what is the probability that she will have them all after buying her first three boxes?
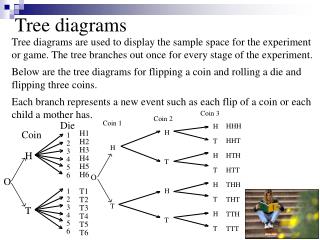
a. In this tree diagram, the first branching represents the possibilities for the first box and the second branching represents the possibilities for the second box. Thus, the four paths from left to right represent all outcomes for two boxes and two toys. Path 2 and Path 3 contain both toys. If the advertisement is accurate about equal distribution of toys, then the paths are equally likely. So the probability of getting both toys is 2/4, or 0.5.
This tree diagram shows all the toy possibilities for three boxes. There are 27 possible paths. You can determine this quickly by counting the number of branches on the far right. Six of the 27 paths contain all three toys, as shown. Because the paths are equally likely, the probability of having all three toys is 6/27, or 0.2222 .
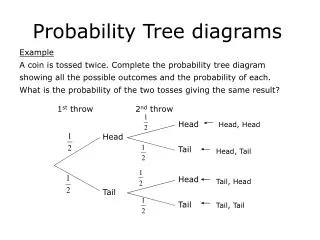
The Multiplication Rule • Step 1 On your paper, redraw the tree diagram for Example A, part a. This time, write the probability on each branch. Then find the probability of each path.
Step 2 Redraw the tree diagram for Example A, part b. Indicate the probability on each branch, and also write the probability of each path. • What is the sum of the probabilities of all possible paths? • What is the sum of the probabilities of the highlighted paths?
Step 3 Suppose the national advertisement mentioned in Example A listed four different toys distributed equally in a huge supply of boxes. Draw only as much of a tree diagram as you need to in order to answer these questions: • a. What would be P(Toy 2) in Talya’s first box? Talya’s second box? Third box? P(any particular toy in any particular box)? • b. In these situations, does the toy she finds in one box influence the probability of there being a particular toy in the next box? • c. One outcome that includes all four toys is Toy 3, followed by Toy 2, followed by Toy 4, followed by Toy 1. What is the probability of this outcome? Another outcome would be the same four toys in a different order. How many such outcomes are there? Are they all equally likely?
Step 4 Write a statement explaining how to use the probabilities of a path’s branches to find the probability of the path. • Step 5 What is P(obtaining the complete set in the first four boxes)?
Example B • Mr. Roark teaches three classes. Each class has 20 students. His first class has 12 sophomores, his second class has 8 sophomores, and his third class has 10 sophomores. If he randomly chooses one student from each class to participate in a competition, what is the probability that he will select three sophomores?
You could consider drawing a tree with 20 branches representing the students in the first class. These would split into 20 branches for the second class, and each of these paths would split into 20 branches for the third class. This would be a tree with 8000 paths! Each class has 20 students. His first class has 12 sophomores, his second class has 8 sophomores, and his third class has 10 sophomores.
Instead, you can draw two branches for each stage of the selection process. One branch represents a choice of a sophomore (S) and one represents a choice of a nonsophomore (NS). • This tree shows all eight possible outcomes. However, the outcomes are not equally likely. • For the first class, the probability of choosing a sophomore is 12/20 =0.6, and the probability of choosing a nonsophomore is 1-0.6 =0.4. • Calculate the probabilities for the second and third classes, and represent them on a tree diagram, as shown. Each class has 20 students. His first class has 12 sophomores, his second class has 8 sophomores, and his third class has 10 sophomores.
The uppermost path represents a sophomore being chosen from each class. In the investigation you learned to find the probability of a path by multiplying the probabilities of the branches. So the probability of choosing three sophomores is (0.6)(0.4)(0.5), or 0.12.
In Example B, the probability of choosing a sophomore in the second class is the same, regardless of whether a sophomore was chosen in the first class. These events are called independent. Events are independent if the occurrence of one has no influence on the probability of the other.
Example C • Devon is going to draw three cards, one after the other, from a standard deck. What is the probability that she will draw exactly two hearts?
The outcome of each draw can be represented by branches on a tree diagram. Rather than list all of the cards in the deck, classify the result of each draw as a heart (H) or nonheart (NH). Study the tree diagram. There are 52 cards in a standard deck, with 13 cards in each suit. Notice that the denominator of each probability for the second draw is 51 because there are only 51 cards left to choose from.
The three highlighted paths show the ways to get exactly two hearts (each has a probability of 0.046 of occurring)
For example, the top highlighted path shows getting a heart on the first draw, a heart on the second draw, and a nonheart on the third draw.
The probability of any event that can occur along multiple paths is the sum of the probabilities of those paths. Thus, the probability that Devon gets exactly two hearts is the sum of the probabilities of the highlighted paths, which is about 0.046 + 0.046 + 0.046 = 0.138.
In a tree diagram, the probability for each simple event along a path may depend on what occurred on the previous branches. In Example C, for instance, the probabilities for the second draw are dependent on the result of the first draw. That is, the events are dependent events.
P(A|B) • You can use conditional probability notation to describe both independent and dependentevents. • The probability of event A given event B is denoted with a vertical line: P(A|B) • For example, to denote the probability of drawing a heart on the second draw given that you have already drawn a nonheart, you write P(H2|NH1).
What does P(H2|H1) denotes? • The probability of drawing a heart on the second draw given that you have already drawn a heart. • Using the tree diagram from Example C, you can see that P(H2|NH1) =13/51 • and P(H2|H1) =12/51.
If events A and B are independent, then the probability of A is the same whether B happens or not. • In this case, P(A|B)= P(A). In Example B, the probability of choosing a sophomore in the second class (S2) is the same whether Mr. Roark chooses a sophomore or a nonsophomore from his first class. This means that P(S2|S1) = P(S2|NS1) = P(S2).
This tree could represent any two-stage event with two options at each stage. To find the probability of event C, you must add all paths, or outcomes, that contain C. P(C)= P(A and C)+ P(B and C) = P(A) • P(C|A) + P(B) •P(C|B)
The main idea of this lesson is that a tree diagram allows breaking down events into stages that are independent so that the multiplication rule applies: The probability of the event is the product of the probabilities of the branches of its path. If the probability of one of the events depends on which path it’s on, it’s a conditional probability.