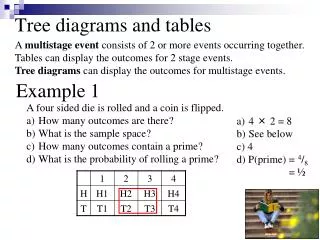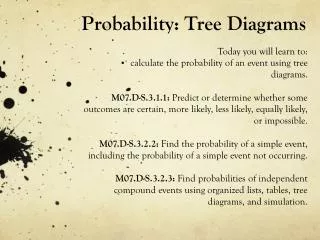
Tree diagrams
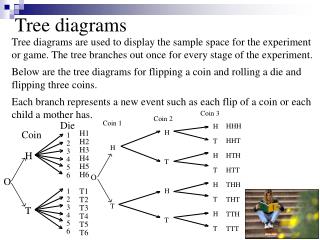
Tree diagrams. What are Tree Diagrams. A way of showing the possibilities of two or more events Simple diagram we use to calculate the probabilities of two or more events . Possible Outcomes. A fair coin is spun twice. 1 st. 2 nd. H. HH. H. T. HT. H. TH. T. T. TT.


Tree diagrams
E N D
Presentation Transcript
What are Tree Diagrams • A way of showing the possibilities of two or more events • Simple diagram we use to calculate the probabilities of two or more events
Possible Outcomes A fair coin is spun twice 1st 2nd H HH H T HT H TH T T TT
Attach probabilities 1st 2nd H HH P(H,H)=½x½=¼ ½ H ½ ½ T HT P(H,T)=½x½=¼ H TH ½ P(T,H)=½x½=¼ ½ T ½ T TT P(T,T)=½x½=¼ INDEPENDENT EVENTS – 1st spin has no effect on the 2nd spin
Calculate probabilities 1st 2nd * H HH P(H,H)=½x½=¼ ½ H ½ ½ * T HT P(H,T)=½x½=¼ * H TH ½ P(T,H)=½x½=¼ ½ T ½ T TT P(T,T)=½x½=¼ Probability of at least one Head?
For example – 10 coloured beads in a bag – 3 Red, 2 Blue, 5 Green. One taken, colour noted, returned to bag, then a second taken. 1st 2nd R RR B RB R G RG INDEPENDENT EVENTS R BR BB B B G BG R GR G GB B G GG
All ADD UP to 1.0 Probabilities 1st 2nd R RR P(RR) = 0.3x0.3 = 0.09 0.3 0.2 B RB P(RB) = 0.3x0.2 = 0.06 R 0.3 G 0.5 RG P(RG) = 0.3x0.5 = 0.15 R BR P(BR) = 0.2x0.3 = 0.06 0.3 0.2 0.2 BB P(BB) = 0.2x0.2 = 0.04 B B 0.5 G BG P(BG) = 0.2x0.5 = 0.10 R GR P(GR) = 0.5x0.3 = 0.15 0.3 0.5 G 0.2 GB P(GB) = 0.5x0.2 = 0.10 B G GG P(GG) = 0.5x0.5 = 0.25 0.5
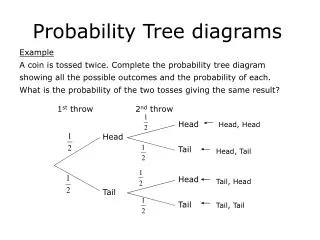
Probability of two or more events Could draw up a table Tree Diagrams P(Outcome) OUTCOMES 2nd Throw 1st Throw P(H,H)=1/2x1/2=1/4 H,H H,T P(H,T)=1/2x1/2=1/4 Could make a list P(T,H)=1/2x1/2=1/4 T,H P(T,T)=1/2x1/2=1/4 T,T H H H H T H T T T T 1/2 1/2 1/2 1/2 1/2 1/2 1/2 Total P(all outcomes) = 1
7 Red 3 Blue. Pick 2, without replacement. a) p(R,R) b) p(B,B) c) p(One of each) 7/10 3/10 OUTCOMES P(Outcome) 2nd event 1st event R,R 6/9 P(R,R)=42/90 3/9 R,B P(R,B)=21/90 7/9 B,R P(B,R)=21/90 2/9 B,B P(B,B)=6/90 Total P(all outcomes) = 1
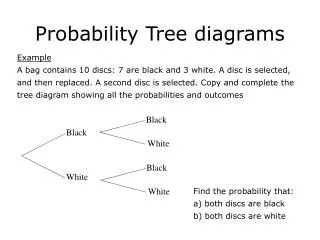
Probability Trees Example 1 A bag contains 6 red beads and 4 blues. 2 beads are picked at random without replacement. (i) Draw a probability tree diagram to show this information (ii) Calculate the probability of selecting both red beads (iii) Calculate the probability of picking one of each colour.
Probability Trees Example 1 A bag contains 6 red beads and 4 blues. 2 beads are picked at random without replacement. (i) Draw a probability tree diagram to show this information (ii) Calculate the probability of selecting both red beads (iii) Calculate the probability of picking one of each colour. 1st Pick 2nd Pick R R B R B B
Probability Trees Example 1 A bag contains 6 red beads and 4 blues. 2 beads are picked at random without replacement. (i) Draw a probability tree diagram to show this information (ii) Calculate the probability of selecting both red beads (iii) Calculate the probability of picking one of each colour. 1st Pick 2nd Pick R ? R ? B ? R ? ? B ? B To Part (ii)
Probability Trees Example 1 A bag contains 6 red beads and 4 blues. 2 beads are picked at random without replacement. (i) Draw a probability tree diagram to show this information (ii) Calculate the probability of selecting both red beads (iii) Calculate the probability of picking one of each colour. 1st Pick 2nd Pick R R B R B B
Probability Trees Example 1 A bag contains 6 red beads and 4 blues. 2 beads are picked at random without replacement. (i) Draw a probability tree diagram to show this information (ii) Calculate the probability of selecting both red beads (iii) Calculate the probability of picking one of each colour. 1st Pick 2nd Pick R R B R B B
Probability Trees Question 1 A bag contains 7 red beads and 3 blues. 2 beads are picked at random without replacement. (i) Draw a probability tree diagram to show this information (ii) Calculate the probability of selecting both red beads (iii) Calculate the probability of picking one of each colour.
Probability Trees Question 1 A bag contains 7 red beads and 3 blues. 2 beads are picked at random without replacement. (i) Draw a probability tree diagram to show this information (ii) Calculate the probability of selecting both red beads (iii) Calculate the probability of picking one of each colour. 1st Pick 2nd Pick R ? R ? B ? ? R ? B ? B To Part (ii)
Probability Trees Question 1 A bag contains 7 red beads and 3 blues. 2 beads are picked at random without replacement. (i) Draw a probability tree diagram to show this information (ii) Calculate the probability of selecting both red beads (iii) Calculate the probability of picking one of each colour. 1st Pick 2nd Pick R R B R B B To Part (iii)
Probability Trees Question 1 A bag contains 7 red beads and 3 blues. 2 beads are picked at random without replacement. (i) Draw a probability tree diagram to show this information (ii) Calculate the probability of selecting both red beads (iii) Calculate the probability of picking one of each colour. 1st Pick 2nd Pick R R B R B B
Probability Trees Question 2 A bag contains 4 yellow beads and 3 blues. 2 beads are picked at random without replacement. (i) Draw a probability tree diagram to show this information (ii) Calculate the probability that both beads selected will be blue (iii) Calculate the probability of picking one of each colour.
Probability Trees Solution2 A bag contains 4 yellow beads and 3 blues. 2 beads are picked at random without replacement. (i) Draw a probability tree diagram to show this information (ii) Calculate the probability that both beads selected will be blue (iii) Calculate the probability of picking one of each colour. 1st Game 2nd Game Y Y B Y B B
Probability Trees Question 3 The probability that Stuart wins a game of darts against Rose is 0.7. They play two games. (i) Copy & complete the probability tree diagram shown below (ii) Calculate the probability Rose winning both games (iii) Calculate the probability of the final result being a draw. 1st Game 2nd Game S S R S R R
Probability Trees Solutions 3 The probability that Stuart wins a game of darts against Rose is 0.7. They play two games. (i) Copy & complete the probability tree diagram shown below (ii) Calculate the probability Rose winning both games (iii) Calculate the probability of the final result being a draw. 1st Game 2nd Game S S R S R R