Download

1 / 12
120 likes | 310 Vues
6.6 Tree Diagrams. Tree Diagram Medical Example Quality Control Example. Tree Diagram.

E N D
6.6 Tree Diagrams • Tree Diagram • Medical Example • Quality Control Example
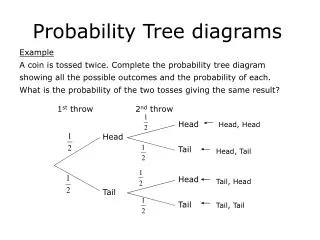
Tree Diagram • A tree diagram helps us represent the various events and their associated probabilities. The various outcomes of each experiment are represented as branches emanating from a point. Each branch is labeled with the probability of the associated outcome. • For example:
Tree Diagram (2) • We represent experiments performed one after another by stringing together diagrams of the sort given in the previous slide. The probabilities for the second set of branches are conditional probabilities given the outcome from which the branches are emanating.
Tree Diagram (3) • For example:
Example Medical • The reliability of a skin test for active pulmonary tuberculosis (TB) is as follows: Of people with TB, 98% have a positive reaction and 2% have a negative reaction; of people free of TB, 99% have a negative reaction and 1% have a positive reaction. From a large population of which 2 per 10,000 persons have TB, a person is selected at random and given a skin test, which turns out positive. What is the probability that the person has active TB?
Example Medical (2) • Make a tree diagram using: • Pr(TB) = 2/10000 = .0002, • Pr(not TB) = 1 - .0002 = .9998, • Pr(TB|Neg) = .98, • Pr(TB|POS) = .02, • PR(NEG|not TB) = .99 and • PR(POS|not TB) = .01.
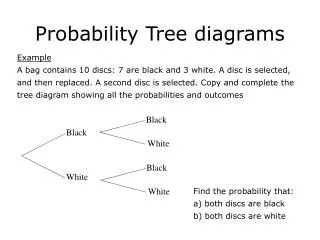
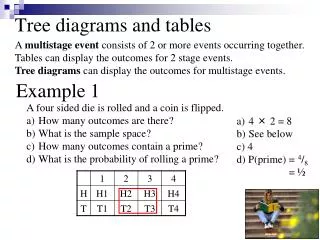
Example Quality Control • A box contains 5 good light bulbs and 2 defective ones. Bulbs are selected one at a time (without replacement) until a good bulb is found. Find the probability that the number of bulbs selected is (i) 1, (ii) 2, (iii) 3.
Example Quality Control (2) • For the first draw, a bulb selected at random is good (G) with probability 5/7 For the first draw, a bulb selected at random is defective (D) with probability 2/7
Example Quality Control (3) • If the first bulb was good, the activity stops. • If the first bulb was defective, then the second selection is good with probability 5/6 and defective with probability 1/6. If the second selection was good, the activity stops. If it was defective, then the third selection is good with probability 1.
Example Quality Control (4) • The tree diagram is:
Summary Section 6.6 • Tree diagrams provide a useful device for determining probabilities of combined outcomes in a sequence of experiments.